Curated OER
Ice Melting Investigation
Students conduct an ice melting investigation in which they observe and measure the melting of two ice spheres. They develop a hypothesis as to which sphere will melt the fastest, collect data every ten minutes, and graph the data using...
Curated OER
Light Beam
Students measure and convert between units. For this geometry lesson, students investigate through measurements of distances. They relate the properties of circle to solving problems with radius, diameter and area.
Curated OER
Time Trials
Students investigate speed, time and distance. In this algebra lesson, students utilize their knowledge of linear equations to solve problems related to time, speed and distance. This assignment is hands on using two toy race cars.
Curated OER
Robo-Pull
Students solve linear equations using two steps. In this algebra lesson, students add, subtract, multiply and divide to solve linear equations. They apply concepts of equations to a robot pulling cargo.
Curated OER
How to Figure Board Feet and Cost of a Board
Students investigate woodworking and converting lengths to cubic measurements. In this math conversions instructional activity, students examine the length of a piece of board, and its total area by using the formula for finding cubic...
Curated OER
Black Out
Pupils collect and analyze data. In this statistics lesson plan, students plot their data on a coordinate plane and find the line of best fit. They calculate the linear regression using the data.
Curated OER
What's Its Slope
Students identify the slope of a lines.In this algebra lesson plan, students define the meaning of slope and write an equation given the slope. They graph linear functions using the slope and y-intercept.
Curated OER
Modeling in Algebra
For this modeling in algebra worksheet, 8th graders solve ten different types of algebra problems, including 5 word problems. They first complete each table, describe the pattern used, and determine the 20th and nth term for each....
Curated OER
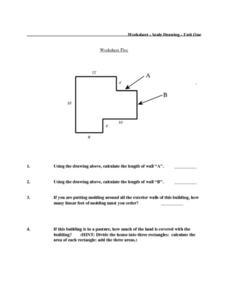
Worksheet Five
In this scale drawing worksheet, students use the scale drawing of a building to calculate the length of two walls. They compute the amount of molding they must order (perimeter). Students calculate the area of the house to determine how...
Curated OER
Gridding a Site
Learners make observations of effigy mounds and record them in a notebook. In groups, they must determine the scale of measurement and create their own grid to scale part of the Effigy Mounds National Monument. They also practice using...
Curated OER
Math: a World of Symmetry
Pupils expand their knowledge of quadrilaterals and identify basic symmetrical forms. Over three weeks, they explore the math, application, and discussion of symmetry. After conducting Internet research, students create symmetrical...
Illustrative Mathematics
Floor Plan
A multi-step problem has learners finding the actual area based on a scale drawing and then converting units at the end. Two different solution choices are listed depending on the preference on which step to start first. Both methods can...
Curated OER
Correlation of Variables by Graphing
Middle and high schoolers use a spreadsheet to graph data. In this graphing lesson, learners determine how two parameters are correlated. They create a scatter plot graph using a computer spreadsheet.
Los Angeles County Office of Education
Assessment for the California Mathematics Standards Grade 7
In need of an all-inclusive seventh grade math resource? Packed full of the topics necessary for Pre-Algebra the packet includes practice problems with different difficulty levels. It works great for any supplemental use needed in the...
American Statistical Association
Scatter It! (Using Census Results to Help Predict Melissa’s Height)
Pupils use the provided census data to guess the future height of a child. They organize and plot the data, solve for the line of best fit, and determine the likely height and range for a specific age.
West Contra Costa Unified School District
Correlation and Line of Best Fit
Computers are useful for more than just surfing the Internet. Pupils first investigate scatter plots and estimate correlation coefficients. Next, they use Microsoft Excel to create scatter plots and determine correlation coefficients and...
Inside Mathematics
House Prices
Mortgages, payments, and wages correlate with each other. The short assessment presents scatter plots for young mathematicians to interpret. Class members interpret the scatter plots of price versus payment and wage versus payment for...
American Statistical Association
How Tall and How Many?
Is there a relationship between height and the number of siblings? Classmates collect data on their heights and numbers of brothers and sisters. They apply statistical methods to determine if such a relationship exists.
Inside Mathematics
Scatter Diagram
It is positive that how one performs on the first test relates to their performance on the second test. The three-question assessment has class members read and analyze a scatter plot of test scores. They must determine whether...
101 Questions
Retina Display
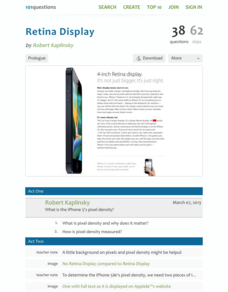
Learners calculate the pixel density of a specific cell phone using the concept of similarity. They use information from the cell phone's website to make their calculations and then compare their results to the posted information.
Achieve
Ground Beef
Ever wonder how a butcher creates the different types of ground beef? Young mathematicians explore the methods butchers use to create their desired ground beef quality. Given a combination of two types of meat with varying leanness,...
Curated OER
Birds' Eggs
More than just data, scatter plots are full of information that can be used to answer a variety of questions. This lesson uses a plot with information about bird egg sizes to answer questions about the relationship between length and...
EngageNY
Determining the Equation of a Line Fit to Data
What makes a good best-fit line? In the 10th part of a 16-part module, scholars learn how to analyze trend lines to choose the best fit, and to write equations for best-fit lines to make predictions.
Curated OER
The Gum Drop
Students find the area of three figure by the traditional formulaic methods. Then they count the number of grid squares to double check. They show an intuitive sense of Pick's Algorithm by counting every two boundary squares as one unit....
Other popular searches
- Linear Measurement Grade 3
- Convert Linear Measurement
- Grade One Linear Measurement
- Linear Measurement Unit Plan
- Math Linear Measurement
- Linear Measurement Lessons
- Technical Linear Measurement
- Math Linear Measurement
- Metric Linear Measurements
- Adding Linear Measurements
- Measurement Customary Linear
- Linear Measurement Metric


