Curated OER
Sweet Data
Students input data about the colors of their serving of M&M candies onto a spreadsheet. They create charts and graphs based on this information.
Curated OER
Bald Eagle Population Graphing
Students create graphs to illustrate the bald eagle population. They identify the population of bald eagles in Minnesota and the United States. They create three graphs to represent the population data including a line, bar, and...
Shodor Education Foundation
Conic Flyer
Graphing conics made easy. Individuals use an interactive to graph conic sections. The app can handle circles, vertical and horizontal parabolas, ellipses, and vertical and horizontal hyperbolas.
Shodor Education Foundation
Multi-Function Data Flyer
Explore different types of functions using an interactive lesson. Learners enter functions and view the accompanying graphs. They can choose to show key features or adjust the scale of the graph.
Curated OER
Music and Sports
With so much talent in the classroom, do your musicians and athletes have related interests? This problem has your learners taking data from their classmates to decide whether there is an association between the two activities. The...
Curated OER
First Day of Class
Students create birthday bar graphs, read books, make math windows, and more for the first day of math class. In this first day of class lesson plan, students also create pyramids.
Georgia Department of Education
The Basketball Star
Have learners use math to prove they are sports stars! Assess a pupil's ability to create and analyze data using a variety of graphs. The class will be motivated by the association of math and basketball data.
CK-12 Foundation
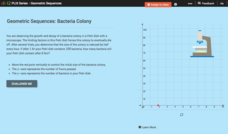
Geometric Sequences: Bacteria Colony
Show budding mathematicians how to model a diminishing bacteria colony two ways—graphically and algebraically. Using the coordinate axis, pupils create a graph to represent the decay of a bacteria colony. They determine the number of...
Curated OER
An "Average" Golf Score
Ninth graders investigate mean, median, and mode. In this mean, median, and mode lesson, 9th graders research gold data for the top ten scores in two golf tournaments. Students make tables and graphs of the data. Students determine...
Curated OER
Reading Graphs
Students read graphs and charts to interpret results. In this algebra lesson, students interpret bar, line and pictographs. They draw conclusions and make predicitons based on these charts.
Curated OER
Tables, Charts and Graphs
Students examine a science journal to develop an understanding of graphs in science. In this data analysis lesson, students read an article from the Natural Inquirer and discuss the meaning of the included graph. Students create a...
Curated OER
Review For Test 3
In this test worksheet, students interpret circle graphs, bar graphs, and line graphs. They match graphs to their appropriate linear equation. Students determine the slope of a line. There are 20 problems on this six page worksheet. ...
Curated OER
Petro Products
For this petroleum products worksheet, students are given the components of crude oil and they graph the various products found in a 50 gallon barrel. Students complete an activity to determine if they have collected cards that represent...
Curated OER
Budget Making
After analyzing a pie graph of national spending, high schoolers express their opinions on priorities for national spending. They create a new bar graph and mail it to their congressional representative with recommendations about needed...
Curated OER
What Is A Rate? Practice Sheet
Your mathematicians practice expressing rates with ratios. They identify from among 12 ratios the ones that are unit rates. They express six given situations as two equal rates each. Finally, they interpret data about fuel efficiency...
CK-12 Foundation
Understand and Create Histograms: Car Sales
Create a history of car sales. Pupils create a histogram/bar graph to show the number of car sales made during the week. Using the data display, learners calculate numerical summaries of the data and find the percent of cars sold during...
Curated OER
Getting the Lead Out
The article for this lesson no longer accessible through the links in the lesson plan, but can be found in the National Center for Biotechnology Information website. After reading it, environmental science young scholars answer questions...
Alcohol Education Trust
Talk About Alcohol: How Much Alcohol is in a Drink?
Introduce your class to alcohol content. In order to become aware of the varying strengths of alcoholic drinks, class members complete a chart and plot a bar chart with the results. They make observations about the results.
Curated OER
Graphs
Students explore graphs and define the different ways they are used to display data. In this algebra lesson, students collect data and plot their data using the correct graph. They draw conclusions from their graphs based on their data.
Curated OER
Chocolate Preferences Voting and Graphing Techniques
Young scholars practice sampling and graphing techniques. In this data collection and interpretation lesson, students write and conduct surveys about chocolate preferences and then collect their data. Young scholars graph the data in...
Curated OER
Graphs and Measurement
Tenth graders analyze graphs and by comparing trees. In this geometry lesson, 10th graders investigate the use of different graphs using bar and regular graphs. They work groups at the computer.
Curated OER
Graphing Data
Young scholars graph lines in a coordinate plane. In this geometry instructional activity, students graph lines on a coordinate plane, and identify the slope. They calculate the volume, area and perimeters of the shapes created on a...
Curated OER
Graphing Surveys
Students collect data and graph it. In this algebra lesson, students create a survey for their classmates and teachers. They analyze the results from the survey and graph it. They draw conclusion from their data based on the graph.
Curated OER
Graph and Compare the Adventure's Temperature Vs. Local Temperature
Pupils explore the concept graphing data. In this graphing data lesson, students use weather data from their local weather and some other city and graph them. Pupils plot the local weather vs. another city. Students record temperature...
Other popular searches
- Skittles Bar Graph
- Double Bar Graphs
- Bar Graphs Pictographs
- Histogram and Bar Graph
- Bar Graphs and Histograms
- Bar Graph Problem Solving
- Favorite Food Bar Graph
- Bar Graphs Histograms
- Interpreting Bar Graphs
- Bar Graphs for Birthdays
- Bar Graph Worksheet
- Bar Graphs and Charts


