Curated OER
Conic Sections and Locii
Students differentiate between ellipse and hyperbola. In this algebra instructional activity, students graph and solve elliptical equations. They use the cabri program to create the different conics and move them around.
Curated OER
Concurrent Lines in Triangles
Students explore the concept of concurrent lines in triangles. In this concurrent lines in triangles lesson, students work in groups to investigate properties of concurrent lines in acute, right, and obtuse triangles. Students use a...
Curated OER
Tangent Properties
Students explore properties of tangent lines. In this properties of tangent lines lesson, students discuss the perpendicular relationship between a tangent line on a circle and the circle's radius. Students use that relationship to...
Curated OER
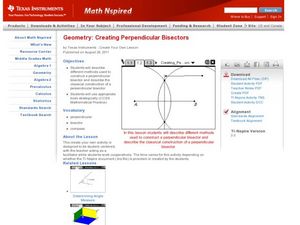
Creating Perpendicular Bisectors
Students create perpendicular bisectors. For this geometry lesson,students use a straight edge and protractor to create a perpendicular bisector. They graph line on the TI and analyze it.
Curated OER
Make Your Own "Weather" Map
Students develop and apply a variety of strategies to solve problems, with an emphasis on multi-step and non-routine problems. They acquire confidence in using mathematics meaningfully.
Curated OER
Angles in Art
Students utilize their handheld and the Angles program to create a non-objective artwork. Images created by famous artists who have utilized angles in their art work are examined.
Curated OER
Composition of Reflections
Learners perform reflections and translations of polygons. In this geometry lesson, students perform reflection in two parallel lines. They use Cabri to observe the transformation and rotations of each shape.
Curated OER
Graphing Data Brings Understanding
Students collect, graph and analyze data. In this statistics lesson, students use circle, pie, bar and lines to represent data. They analyze the data and make predictions bases on the scatter plots created.
Curated OER
Make Your Own "Weather" Map
Pupils create their own "weather" map using data from x-ray sources. They analyze and discuss why it is important to organize data in a fashion in which is easy to read. They compare and contrast different x-ray sources using a stellar map.


