Curated OER
Going with the Flow
Students survey each other and determine their common interests. They examine the use of algorithms by various websites that are used to develop networks of interest groups among users. They then design proposals for a social networking...
Curated OER
Year Book Page Special Shape Collage
Students design a collage of pictures for a yearbook that make a shape. They determine the area of the shape and the price of putting the collage in the yearbook.
Curated OER
Map Your School
Learners participate in a project to map their school. They measure and graph various areas around the school. Learners find the longitude and latitude of the school and research the school's history, and highlight special important areas.
Curated OER
Play Ball!
Students pretend as if they have been hired by the commissioner of Major League Baseball. Their task is to explain the mathematics of baseball so that more people enjoy the game.
Curated OER
The Power of PV: Measuring the Power and Energy of Photovoltaic System
Students explore photovoltaic systems. In this alternative energy lesson, students calculate solar panel efficiency and convert devices to solar energy using photovoltaic cells.
Mathematics Assessment Project
Interpreting Distance–Time Graphs
Pre-algebra protégés critique a graph depicting Tom's trip to the bus stop. They work together to match descriptive cards to distance-time graph cards and data table cards, all of which are provided for you so you can make copies for...
Curated OER
Another Way of Factoring
Focusing on this algebra lesson, learners relate quadratic equations in factored form to their solutions and their graph from a number of different aspects. In some problems, one starts with the original equation and finds the solutions....
Curated OER
Exploring Renewable Energy Through Graphs and Statistics
Ninth graders identify different sources of renewable and nonrenewable energy. In this math lesson, learners calculate their own carbon footprint based on the carbon dioxide they create daily. They use statistics to analyze data on power...
Curated OER
Inquiry Unit: Modeling Maximums and Minimums
Young mathematicians explore the maximun area for patio with the added complexity of finding the mimimum cost for construction. First, they maximize the area of a yard given a limited amount of fence and plot width v. area on a scatter...
Curated OER
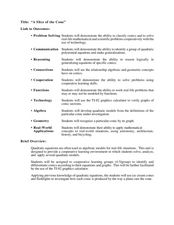
"A Slice of the Cone"
Here is a set of lessons that explore conics in a number of different ways. Starting with modeling how a conic is produced by the way a plane cuts the cone, to solving complex word problems, algebra learners progress through a series of...
Radford University
A Change in the Weather
Explore the power of mathematics through this two-week statistics unit. Pupils learn about several climate-related issues and complete surveys that communicate their perceptions. They graph both univariate and bivariate data and use...
Curated OER
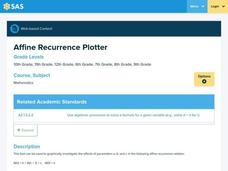
Affine Recurrence Plotter
Learners use the on-line affine recurrence plotter to graph equations. They work on-line to create graphs of trout in a trout pond and savings account balances when interest is compounded over time. Links to the four one-day lessons are...
Curated OER
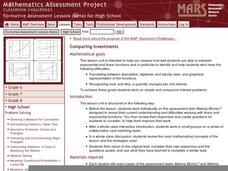
Comparing Investments
Money, money, money. A complete activity that makes use of different representations of simple and compound interest, including written scenarios, tables, graphs, and equations to highlight similarities and differences between linear and...
MARS, Shell Center, University of Nottingham
Defining Regions Using Inequalities
Your young graphers will collaboratively play their way to a better understanding of the solution set produced by the combining of inequalities. Cooperation and communication are emphasized by the teacher asking questions to guide the...
Mathematics Assessment Project
Maximizing Profits: Selling Boomerangs
You'll return to this resource again .. .and again ... and again. Class members determine the maximum profit of a boomerang-making business by solving a system of equations. They then review and analyze provided sample responses to the...
Inside Mathematics
Swimming Pool
Swimming is more fun with quantities. The short assessment task encompasses finding the volume of a trapezoidal prism using an understanding of quantities. Individuals make a connection to the rate of which the pool is filled with a...
Teach Engineering
Energy Perspectives
The data says ... the resource is great to use. Using Microsoft Excel, pupils analyze data from the US Department of Energy in the fifth lesson of a 25-part Energy Systems and Solutions unit. Each group looks at a different data set and...
Curated OER
Word Problems
Students solve word problems using mathematical symbols. In this algebra lesson, students collect data and analyze it. They analyze the data using a table or graph after plotting the data.
Curated OER
Play It
There are a number of activities here that look at representing data in different ways. One activity, has young data analysts conduct a class survey regarding a new radio station, summarize a data set, and use central tendencies to...
Curated OER
Web Adventure -- Oakland to Chicago Flight
Students develop an awareness of mathematics in a diverse number of careers, then describe three duties of a pilot that require mathematical skills. They increase understanding of interpreting data relationships presented in table format.
Curated OER
Discovering Different Types of Functions
Graph polynomials and identify the end behavior of each polynomial function. The class differentiates between linear, quadratic, and other polynomial equations.
Curated OER
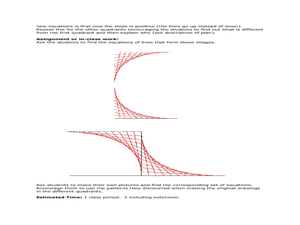
Mathematics of Doodles
Students use the slope and y-intercept to graph lines. For this algebra lesson, students graph linear equations and apply it to solving real life problems.
Curated OER
CSI Rhino
Students study the rhinoceros and how the species has survived for so long. In this rhino lesson students create graphs and research what is being done to protect the rhino.
Curated OER
Mandala Art
Learners investigate art elements such as color schemes and proportion by creating their own personal Mandala Circle on paper or canvas. This also allows students to investigate mathematical concepts such as tesselations or social...
Other popular searches
- Graphic Design Lessons
- Graphic Design Principles
- Graphic Design Packaging
- Teaching Graphic Design
- Graphic Design Typography
- Graphic Design Logo
- Graphic Design Posters
- Art Graphic Design
- Graphic Design Art Lessons
- Graphic Design Jobs
- Graphic Design Movie Poster
- Graphic Design Cd Covers


