Curated OER
Circles Minilab
Students learn how to measure the diameter and circumference of a circle. In this circle lesson, students organize their data to create a graph. Students utilize their graph to make an inference about the slope of pi.
Curated OER
Quadratic Applications
In this quadratic applications worksheet, young scholars complete graphs, charts, comparison charts, and more having to do with quadratic equations. Students complete 5 different activities.
Curated OER
Race Track (Culminating Activity)
Young scholars graph and solve linear equations. In this algebra activity, students use the slope and y-intercept to graph lines. They relate lines to the real world using different applications.
Curated OER
A Thanksgiving Survey
Learners conduct a survey. In this math lesson, students design and conduct a survey about Thanksgiving foods. Learners display the collected data in a graph and use the graph to determine what food to serve for a Thanksgiving meal.
Curated OER
Chapter 11 - Objective 6.1 Parabola
In this parabolic exercise, learners find the vertex and axis of symmetry of parabolas, hyperbolas, and ellipses. They sketch the graph. This one-page worksheet contains ten problems.
Curated OER
Angles and Arcs
In this angles and arcs worksheet, 10th graders solve 18 various types of problems related to determine various angles and arcs of a circle. First, they find the measure of each angle and arc of the first circle shown. Then, students...
Curated OER
Inverse of a Function
In this inverse of function worksheet, 10th graders solve and graph 10 different problems that include graphically represented inverse functions. First, they solve each of the problems involving graphs and their inverses. Then, students...
Curated OER
How High Are the Clouds?
Pupils analyze height and collect data to create a graph. In this statistics lesson, students use central tendencies to analyze their data and make predictions. They apply concept of statistics to other areas of academics to make a...
Curated OER
Impact!!
Pupils perform a science experiment. In this algebra lesson, students collect data from their experiment and create a graph. They analyze the graph and draw conclusion.
Curated OER
Information at a Glance - Using Tables in Mathematics
Students create table to display GED Testing data located in paragraph provided by teacher, use information in table to create appropriate graph, and determine percentage difference between passing scores and failing scores.
Curated OER
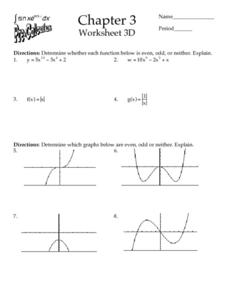
Chapter 3 - Worksheet 3D
In this pre-calculus worksheet 3D, students determine if a function is even or odd. They sketch graphs of functions and find the inverse of functions. This two-page worksheet contains 18 problems.
Curated OER
Linear Inequalities
In this linear inequalities activity, students graph and shade 6 linear inequalities. Students then graph and shade 3 absolute value inequalities.
Curated OER
Can You Make a Hole in One?
Young scholars relate miniature golf to reflection of an image. In this algebra instructional activity, students collect and graph data as they study linear equations. They apply properties of graphing to solve real life scenarios.
Curated OER
Slopes of Lines
In this slopes of lines worksheet, 10th graders solve and graph 10 different problems. First, they determine the slope of each line named in the figure and any line parallel to line b and perpendicular to line d. Then, students graph the...
Virginia Department of Education
Factoring for Zeros
Relate factors to zeros and x-intercepts. Scholars first graph quadratics in both standard and factored forms to see that they are the same. They go on to use the graphs to see the relationship between factors and x-intercepts.
Curated OER
Rainbows, Bridges & Weather, Oh My!
Explore how real-world applications can be parabolic in nature and how to find quadratic functions that best fit data. A number of different examples of modeling parabolas are explored including a student scavenger hunt, the exploration...
Illustrative Mathematics
Tides
A very simple example of a functional relationship between depth of water and time is shown here. In fact, it might be more useful to use a coastal tide book to better illustrate this real-world experience. Pupils are to count the number...
Curated OER
Worksheet 10: Continuous Functions
In this math worksheet, students answer 7 questions regarding continuous functions, domains, differentiables, and inverse functions.
PBS
The Yo-Yo Problem
What do yo-yos and pennies have to do with linear equations? Learn about writing and solving linear equations while considering the Yo-Yo Problem and Penny Pattern Exploration from the High School Math Project. Learners utilize algebra...
Curated OER
Domain and Range
In this domain and range worksheet, students write the definitions for relation, function, domain and range. They then find the domain and range of 7 sets of ordered pairs. Finally, students answer 4 questions regarding inverse relations...
College Board
Frozen in Time
Take a closer look at increasing and decreasing behavior by zooming in on graphs. An AP® Calculus reference document examines how increasing/decreasing behavior should be considered in terms of intervals rather than points. The resource...
Curated OER
Scientific Graphs
Students organize data collected from their experiments using graphs. In this statistics and biology lesson, students organize their scientific data from an article into readable graphs. They define the usefulness of their graph and...
Curated OER
Graph Dynamic Linear Equations
Students explore the concept of linear equations. In this linear equation lesson, students change parameters of an equation and notice the effect it has on its graph.
Curated OER
Creating Line Graphs
High schoolers draw line graphs. In this math lesson, students interpret minimum wage data and graph the data in a line graph. High schoolers predict the next minimum wage and figure the earnings for a 40 hour work week for someone...
Other popular searches
- Charts and Graphs
- Bar Graphs
- Line Graphs
- Double Bar Graph
- Circle Graphs
- Pie Charts and Graphs
- Picture Graphs
- Coordinate Graphs
- Skittles Bar Graph
- Reading Charts and Graphs
- Blank Coordinate Graphs
- Percent Circle Graph


