Texas Instruments
Golden Ratio Lab
Learners investigate the Golden Ratio in this algebra I or geometry lesson. They explore the Golden Ratio as the conduct an experiment in which they collect various measurement from their team members and find the regression equations...
Curated OER
Pythagorean Theorem
Students solve problems using the Pythagorean Theorem. In this geometry lesson plan, students identify the sides and angles of a right triangle. They find the different trigonometric ratios and solve using sine, cosine and tangent.
Curated OER
Time Trials
Students investigate speed, time and distance. In this algebra lesson, students utilize their knowledge of linear equations to solve problems related to time, speed and distance. This assignment is hands on using two toy race cars.
Curated OER
The Swinging Pendulum
Students observe a pendulum and graph their observation. In this algebra lesson, students use the TI calcualtor to graph the motion the pendulum makes. They analyze the graph and make predictions.
Curated OER
How to Figure Board Feet and Cost of a Board
Students investigate woodworking and converting lengths to cubic measurements. In this math conversions instructional activity, students examine the length of a piece of board, and its total area by using the formula for finding cubic...
Curated OER
Light Bounce
Students solve problems involving triangles. In this geometry lesson plan, students apply properties of triangles to find the missing angles and sides. They identify angles of parallel lines cut by a transversal.
Curated OER
Hot Wheels
Students observe the action produced by toy cars. In this geometry lesson, students discuss motion and distance as they relate to the movement of a spherical object.They collect data and make conjectures based on their data.
Curated OER
What are the Odds
Students predict the-outcome of an event. In this algebra lesson, students compare and contrast the probability of an event occurring. They calculate the odds of a simple event and make estimation.
Curated OER
Differentials
Students investigate Differential equations using derivatives. For this calculus lesson, students solve problems of differential equations by taking the derivative and explaining the changes that occurred in the equation and circle. They...
Curated OER
The Slope of a Curve
Students graph the slopes of a line using the intercepts. For this precalculus lesson, students identify the properties of a curve slope. They find the limit and use a graping calculator to graph their lines.
Curated OER
La Toteca- A Tropical Paradise
Students collect data on the time of the ferry. For this algebra lesson, students use the data to predict a ferry schedule. They also compute the depth where oxygen would be needed when diving.
Curated OER
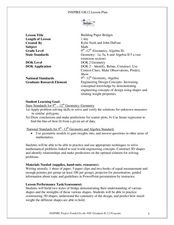
Building Paper Bridges
Young scholars construct a bridge that can hold 100 pennies. In this math instructional activity, students evaluate the strength of their bridges. They predict how much weight a bridge can hold based on its design.
EngageNY
The Height and Co-Height Functions of a Ferris Wheel
Show learners the power of mathematics as they model real-life designs. Pupils graph a periodic function by comparing the degree of rotation to the height of a ferris wheel.
Curated OER
Reading Graphs
Students plot functions on the Cartesian coordinate plane. They explore lines and parabolas. Students analyze graphs and answer questions about the information presented on the graph using an online program.
Curated OER
Graphing and the Coordinate Plane
Students gain practice reading coordinates and plotting points by participating in the Coordinates! Game. They demonstrate and test their skills with graph paper and the Maze Game.
Curated OER
Describing Data
Your learners will practice many ways of describing data using coordinate algebra in this unit written to address many Common Core State Standards. Simple examples of different ways to organize data are shared and then practice problems...
Curated OER
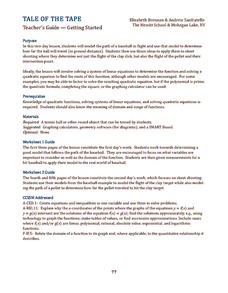
Tale of the Tape
How can baseball and skeet-shooting be modeled mathematically? Sports lovers and young mathematicians learn how to use quadratic equations and systems of equations to model the flight paths of various objects.
Curated OER
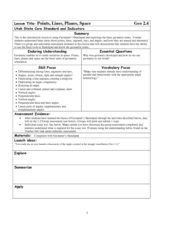
Points, Lines, Planes, and Space
In this points, lines, planes, and space worksheet, students solve word problems dealing with points, lines, planes, and space. Students complete 20 individual problems and 20 group problems.
Curated OER
A Model Solar System
If Earth is modeled by a grapefruit, what planet could be represented by a golf ball? This activity uses everyday and not-so-everyday objects to create a model of the Solar System.
Curated OER
Water Down the Drain
Did you know that leaky faucets waste $10 million worth of water? Conservationists perform an experiment and draw best-fit lines to explore how the US Geological Society determined this value.
Curated OER
Cartesian Coordinate System
Students research the Cartesian Coordinate System and its many uses in the world of mathematics and algebra.
Curated OER
Introduction to Polynomials
Students analyze the graphs of polynomial functions, examine vocabulary associated with polynomials, and determine the maximum number of real roots possible for a polynomial
Curated OER
Introduction to Scatter Plots and Correlation
Learners examine the concept of scatter plots. They compare baseball statistics to locate the ones that correlate with winning, and identify the positive, negative, and no correlation in sets of data using MS Excel.


