Curated OER
Go the Distance
Students work together to build lego cars. They make predictions about how fast they believe the cars will go. They record their observations and discuss their results.
Curated OER
Reading Graphs
Students plot functions on the Cartesian coordinate plane. They explore lines and parabolas. Students analyze graphs and answer questions about the information presented on the graph using an online program.
Curated OER
Exploring Equations and Y-Intercept
Students graph linear equations using intercepts, find y-intercept, find x-intercepts and graph linear equations that use horizontal and vertical lines.
Curated OER
Collecting And Fitting Quadratic Data
Students investigate the concept of using quadratic data to plot coordinates on a plane. They also apply the quadratic formula for a variety of problems with the help of a graphing calculator to draw the parabola for given coordinates.
Curated OER
Math and Architectural Design in Relation to Rebuilding The World Trade Center
Students discover building plans and practice reading measurements. In this architectural design activity, students investigate the areas of the specific World Trade Center locations that need to be rebuilt and determine the cost....
Curated OER
Systems of Inequalities
For this Algebra I/Algebra II worksheet, students determine the solution to a system of inequalities by graphing. The two page worksheet contains explanation, instruction, and four worked problems.
Curated OER
Round and Round and Round We Go!
Students investigate motion using a CBL. In this algebra lesson, students collect and graph data on a coordinate plane. They define and identify amplitude and period of conic graphs.
Curated OER
Building Paper Bridges
Young scholars construct a bridge that can hold 100 pennies. In this math instructional activity, students evaluate the strength of their bridges. They predict how much weight a bridge can hold based on its design.
Curated OER
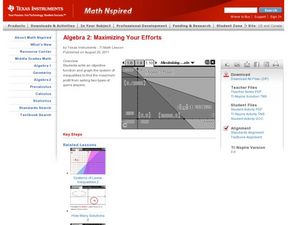
Maximizing Your Efforts
High schoolers graph systems of equation. In this algebra lesson, students find where the lines cross and identify the type of solution. They analyze a graph and write the equation of the line.
Curated OER
Optimization For Breakfast
Students identify he proportion of a cereal box. In this algebra lesson, students define the relationship between patterns, functions and relations. They model their understanding using the cereal box.
Curated OER
Data and Scientific Graphs
Learners conduct experiments and graph their data. In this statistics instructional activity, students collect data and graph it on a coordinate plane. They analyze the data looking for patterns and they discuss their findings with the...
Curated OER
Conductivity of salt Solutions
Students investigate the concentration level of solutions. In this math/science lesson, students identify three different ionic compounds. They predict the conductivity of each using their collected data.
Curated OER
Topic 6: Evaluating and Presenting Results
Students construct spreadsheets from raw data. In this spreadsheet construction lesson, students compile data into Microsoft Excel. Students familiarize themselves with entering and presenting data in a spreadsheet.


