Curated OER
Solving Absolute Value Inequalities
Start this activity with a brief description of how to solve absolute value inequalities. A space is provided to help classify the inequalities into types (greater than, less than, or equal to) and for learners to show how to graph their...
Curated OER
How Does Your Population Grown?
Do you know how the population has grown of your community? Can you predict the population over the next half century? Can we find an algebraic model that matches our data? These along with many more questions can be researched by...
Curated OER
Highs and Lows
Solve problems using integration and derivatives. By using calculus, learners will analyze graphs to find the extrema and change in behavior. They then will identify the end behavior using the derivatives. Activities and handouts are...
Curated OER
The Way to Better Grades!
Pupils collect and analyze data. In this statistics lesson, learners create a scatter plot from their collected data. They use, tables and graphs to analyze the data and mae decisions.
Virginia Tech
Unit Plan: Exponential and Logarithmic Functions
A six-day unit for algebra II on exponential and logarithmic functions builds upon Chapter 12 of Merrill Algebra II with Trigonometry; Applications and Connections. The text provides assistance in the depth of instruction and homework...
Curated OER
Order of Operations
Ninth graders investigate the order of operations. In this Algebra I lesson plan, 9th graders explore the rules of arithmetic and algebra as they review and practice simplifying increasingly complex numeric expressions using the order...
Curated OER
Slope
Students calculate the slope of a line. In this slope lesson, students use a graph, an equation or two points to help them calculate the slope of a line. They differentiate between a slope of zero and an undefined slope.
Curated OER
The Window Problem
Students identify patterns and compute formulas to solve the problems. In this algebra lesson, students come up with a rule given a pattern, and analyze the relationship between data and graphs.
Curated OER
Stressed to the Breaking Point
Students explore the relationship between the amount of weight that can be supported by a spaghetti bridge, the thickness of the bridge, and the length of the bridge to determine the algebraic equation that best represents that pattern...
Curated OER
Polly and the Shapeshifter
Students analyze the patterns in polygons and relate it to the rate of change. In this algebra lesson, students discuss the relationship between the data and the graph of the data.
Curated OER
The Tipping Point
Students rewrite word problems and solve using math. In this word problem lesson, students gather data and observe the data. They relate this process to the scientific method and math. They review their data to be able to answer...
Curated OER
Calculator-Based Lessons Help Examine Real-World Data
Students may determine equations based on graphs and regression models.
Curated OER
The Mandelbrot Set
Students explore the Mandelbrot Set. They are introduced to the concept of a complex number and function in order to motivate the discussion of Julia and Mandelbrot sets. Students investigate fractals and how they are built.
Curated OER
Miami Metrozoo & Mathematics
Twelfth graders use Algebra and Geometry to solve a real life problem at the Zoo.
Curated OER
Properties of Angles, Lines, and Triangles
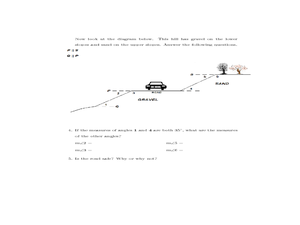
In this properties of angles, lines and triangles instructional activity, 10th graders solve and complete 28 different problems that include determining the measurement of various figures shown. First, they use the geometric properties...
Curated OER
Practicing Arithmetic
Students practice single operation arithmetic ranging from single digit addition to long division of decimals or real numbers using Graphit. They use data sets and rules to graph ordered pairs.
Curated OER
The Quadratic Formula
Students solve quadratic function by completing the square. In this algebra lesson plan, students use the quadratic formula to factor quadratics and find the roots. They graph the parabola and identify its properties.
Curated OER
What's The Point?
Students solve word problems using the correct math symbols. In this algebra lesson, students use the TI calculator to graph their equation and analyze it. They find the line of regression and use to draw conclusion.
Curated OER
Between The Extremes
Students analyze graphs for specific properties. In this algebra lesson, students solve equations and graph using the TI calculator. They find the different changes that occur in each graph,including maximum and minimum.
Curated OER
What Are The Chances
Students calculate the probability of an event occurring. In this probability instructional activity, students differentiate between independent, dependent or compound events. They find the range of the data.
Curated OER
Exploring Arrangements of 2, 3, 4, and 5 Cubes
Learners use problem solving skills to create various models of tricubes, tetracubes, and pentacubes. They classify the cubes into various groupings and identify them as mirror images, regular arrangements, and irregular arrangements....
Curated OER
Means of Growth
Students collect and graph data. In this statistics lesson, students analyze their plotted data using a scatter plot. They identify lines as having positive, negative or no correlation.
Curated OER
Optimization For Breakfast
Students identify he proportion of a cereal box. In this algebra lesson, students define the relationship between patterns, functions and relations. They model their understanding using the cereal box.
Alabama Learning Exchange
The State Capital of Stem and Leaf
Students explore the concept of stem and leaf plots. For this stem and leaf plots lesson, students plot the 50 US states' capitals on a stem and leaf plot according to the first letter of each state. Students compare their stem and...
Other popular searches
- Rates Linear Relationships
- Linear Pair of Angles
- Geometry Linear Pair
- Linear Pair Postulate
- Graphing Linear Relationships
- Non Linear Relationships


