Curated OER
What's The Point?
Learners solve word problems using the correct math symbols. In this algebra lesson, students use the TI calculator to graph their equation and analyze it. They find the line of regression and use to draw conclusion.
Curated OER
Between The Extremes
Students analyze graphs for specific properties. In this algebra lesson, students solve equations and graph using the TI calculator. They find the different changes that occur in each graph,including maximum and minimum.
Curated OER
What Are The Chances
Students calculate the probability of an event occurring. In this probability lesson, students differentiate between independent, dependent or compound events. They find the range of the data.
Curated OER
Exploring Arrangements of 2, 3, 4, and 5 Cubes
Students use problem solving skills to create various models of tricubes, tetracubes, and pentacubes. They classify the cubes into various groupings and identify them as mirror images, regular arrangements, and irregular arrangements....
Curated OER
Means of Growth
Students collect and graph data. In this statistics lesson, students analyze their plotted data using a scatter plot. They identify lines as having positive, negative or no correlation.
Curated OER
Optimization For Breakfast
Students identify he proportion of a cereal box. In this algebra lesson, students define the relationship between patterns, functions and relations. They model their understanding using the cereal box.
Alabama Learning Exchange
The State Capital of Stem and Leaf
Students explore the concept of stem and leaf plots. In this stem and leaf plots lesson, students plot the 50 US states' capitals on a stem and leaf plot according to the first letter of each state. Students compare their stem and leaf...
Curated OER
Gender and Income
Students investigate Income and gender preference. In this statistic lesson, students collect data of Income to see if one gender makes more than the other. Students examine the data and draw conclusions.
Curated OER
Slippery Slope
Learners define patterns, relation and function. In this algebra lesson, students find the slope of a line and write equations of line. They model the slope using real life scenarios.
Curated OER
STRETCHING SPRING
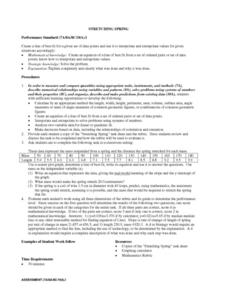
Students calculate the length, width, height, perimeter, area, volume, surface area, angle measures or sums of angle measures of common geometric figures. They create an equation of a line of best fit from a set of ordered pairs or...
Curated OER
Conjectures and Conclusions
Learners draw conclusions and make conjectures given a specific scenario. In this geometry lesson plan, students model real life scenarios using properties of triangles. They model number facts and explain why the outcome is what it is.
Curated OER
Investing
Learners collect data on investments and draw conclusions. In this algebra lesson, students analyze exponential graphs as they relate to money. They discuss the cause of an account balance being high or low.
Curated OER
The Absolute Truth
Young scholars solve problems of inequalities and equations. In this algebra lesson, students add, subtract, multiply and divide to solve inequalities. They graph their solutions on a number line.
Curated OER
Walking on Air
Students collect and analyze data with a graph. In this statistics lesson, students use central tendencies to find the meaning of their data. They display the data on a Ti calculator.
Curated OER
Dimension and Rank
Students determine the dimension of a subspace. In this dimension and rank instructional activity, students explore the dimension of a vector space. They compare and explore the relationship in a matrix.
Curated OER
Comparison of Two Different Gender Sports Teams - Part 1 of 3 Measures of Central Tendency
Students gather and analyze data from sports teams. In this measures of central tendency lesson, students gather information from websites about sports team performance. Students analyze and draw conclusions from this data. This lesson...
Curated OER
Writing a Function Rule
In this Algebra I/Algebra II worksheet, students determine the equation that correctly represents the relationship between the x and y values provided. The one page worksheet contains four multiple choice problems. Answers are not...
Curated OER
How High Are the Clouds?
Students analyze height and collect data to create a graph. In this statistics lesson, students use central tendencies to analyze their data and make predictions. They apply concept of statistics to other areas of academics to make a...
Curated OER
The Swinging Pendulum
Students observe a pendulum and graph their observation. In this algebra lesson, students use the TI calcualtor to graph the motion the pendulum makes. They analyze the graph and make predictions.
Curated OER
Exponential and Exponents Functions
Pupils solve problems using exponential properties. In this algebra lesson, students differentiate between exponents, exponential and log functions. They graph their functions using table and exponents.
Curated OER
Will Exams Be Cancelled?
If the flu outbreak continues, exams will have to be canceled. Investigate the properties of exponential and logarithmic functions. For this algebra lesson, students use the TI to examine and differentiate between exponential growth and...
Curated OER
La Toteca- A Tropical Paradise
Students collect data on the time of the ferry. For this algebra lesson, students use the data to predict a ferry schedule. They also compute the depth where oxygen would be needed when diving.
Curated OER
The Price Is Right
Students create a list of products with estimated prices. In this algebra instructional activity, students learn to write equations using variables. They match their created list with that of actual products and compare their prices,
Curated OER
Water: On the Surface and in the Ground
High schoolers explore the differences between surface water and ground water. They collect data using maps and graphs and investigate a Texas river basin and a nearby aquifer. They complete a written report including maps and data...
Other popular searches
- Rates Linear Relationships
- Linear Pair of Angles
- Geometry Linear Pair
- Linear Pair Postulate
- Graphing Linear Relationships
- Non Linear Relationships


