Statistics Education Web
Double Stuffed?
True or false — Double Stuf Oreos always contain twice as much cream as regular Oreos. Scholars first measure the masses of the filling in regular Oreos and Double Stuf Oreos to generate a class set of data. They use hypothesis testing...
Statistics Education Web
Consuming Cola
Caffeine affects your heart rate — or does it? Learners study experimental design while conducting their own experiment. They collect heart rate data after drinking a caffeinated beverage, create a box plot, and draw conclusions. They...
Education Development Center
Interpreting Statistical Measures—Class Scores
Explore the effect of outliers through an analysis of mean, median, and standard deviation. Your classes examine and compare these measures for two groups. They must make sense of a group that has a higher mean but lower median compared...
Curated OER
Section 15-9: Permutations
In this permutations activity, high schoolers solve 16 multiple choice and short answer questions. Students find factorials and permutations of letters and numbers.
Curated OER
Standard Deviation
In this standard deviation worksheet, students solve and complete 10 different types of problems. First, they determine the number of standard deviations an item was from its mean. Then, students draw a model of what this would look...
Curated OER
Hypothesis Testing Summary and Exercise Sets
In this thirteen page worksheet, students solve four sets of exercises concerned with hypothesis testing. A hypothesis testing summary is provided.
Curated OER
Counting Techniques
In this counting instructional activity, students solve fifteen counting exercises using the appropriate counting technique. Solutions are provided on the last page.
Curated OER
Bob's Bagel Shop
How much money can Bob expect to make per customer by selling bagels? This short expected value problem can be used as a warm up or a quick assessment at the end of a more detailed lesson. Teacher commentary includes the solution to the...
Curated OER
Flipping for a Grade
What happens when your teachers get tired of grading tests and want to use games of chance to determine your grade? How would you decide which game they should play? Learn how to use expected value and standard notation to compare two...
Curated OER
Sounds Really Good! (sort of...)
Your friend Phil wants to know if he should play the lottery. Have your class use the given data to compute the expected value and explain to Phil what he should do and why. This handout is ideal for a quick assessment of skill and...
Illustrative Mathematics
Do You Fit In This Car?
A short activity that focuses on the normal distribution as a model for data distribution. Using given means and standard deviations, your budding statisticians can use statistical tables, calculators, or other statistical software to...
Illustrative Mathematics
Accuracy of Carbon 14 Dating I
Here is an activity that is intended to highlight a very important issue about precision in reporting and understanding statements in a realistic scientific context. Discuss different ways of reporting the half life of Carbon 14 using...
Curated OER
School Advisory Panel
How would you choose three students from your class to be on a school panel that would represent a fair and representative view of opinions? This brief activity offers four different sampling methods to choose from and asks for...
Curated OER
A Ststistical Study on the Letters of the Alphabet
In this Statistics and Probability worksheet, students create a line plot for the first 100 letters in the Preamble to the constitution and compare their frequency distributions to the actual frequency distribution. The one page...
Curated OER
Statistics: Final Exam Review
In this statistics and probability worksheet, students are provided with a review of the final exam in statistics. The three page worksheet contains a combination of six multiple choice and free response questions. Answers are not...
Curated OER
Measures of Central Tendencies: Quartiles
In this statistics activity, students calculate the mean, median, mode, range, lower quartile, and upper quartile for 10 questions and interpret a box and whiskers graph.
Curated OER
Table Readings
In this table learning exercise, learners read questions and interpret tables. Questions include information concerning unemployment, oil imports, and foreign students. This multiple-choice learning exercise contains 10 problems. ...
Curated OER
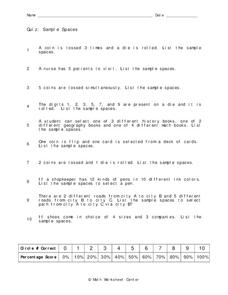
Sample Spaces
In this sample spaces activity, 9th graders solve 10 different word problems that include sample spaces in each. First, they toss a coin and roll a die listing the sample spaces for each. Then, students flip one coin and select a card...
Curated OER
Mean, Standarad Deviations, and Variances
For this Statistics worksheet, 11th graders compute the mean, standard deviation and variances for four different problem scenarios. The one page worksheet contains four scenarios, each with eight questions. Answers are provided.
Curated OER
Statistical Analysis
In this statistics worksheet, students analyze the data provided in order to determine the null hypothesis, an alternate hypothesis, and the significant difference between the groups. The one page worksheet contains three scenarios with...
Curated OER
Data Handling
For this data handling worksheet, students explore multiple ways to represent data. They create stem and leaf plots, histograms, and bar charts. Students examine and interpret diagrams and statistics. This eleven-page worksheet...
Curated OER
Working with Frequency Tables
In this Working with Frequency Tables worksheet, students analyze data that is organized in simple frequency charts. They calculate average from data presented in a frequency table, calculate a cumulative score, and identify data that...
Other popular searches
- Fun Math Probability Games
- Probability/math Literature
- Smart Board Math Probability
- Grade 1 Math Probability
- Math Probability Vocabulary
- Math Probability Worksheets
- Sport Math Probability
- Math Probability Factorial
- Math Probability Games
- Grade 4 Math Probability
- Math Probability Lessons
- Probability and Sports Math


