Education World
Putting Turkey on a Table (or a Graph)
Grateful learners put turkey on a table (or a graph)! Through a creative project they show statistical information about turkey population, production, and consumption. A great Thanksgiving lesson that can be applied at any time to the...
Curated OER
Exploring Renewable Energy Through Graphs and Statistics
Ninth graders identify different sources of renewable and nonrenewable energy. In this math lesson, learners calculate their own carbon footprint based on the carbon dioxide they create daily. They use statistics to analyze data on power...
EngageNY
Solution Sets to Equations with Two Variables
Can an equation have an infinite number of solutions? Allow your class to discover the relationship between the input and output variables in a two-variable equation. Class members explore the concept through tables and graphs and...
Virginia Department of Education
Nonlinear Systems of Equations
Explore nonlinear systems through graphs and algebra. High schoolers begin by examining the different types of quadratic functions and their possible intersections. They then use algebraic methods to solve systems containing various...
Virginia Department of Education
Equations of Lines
Scholars connect slope-intercept form and standard form to the values of m and b by first matching a set of cards that have slope-intercept form, standard form, values of m, values of b, and graphs of linear equations. They then play a...
West Contra Costa Unified School District
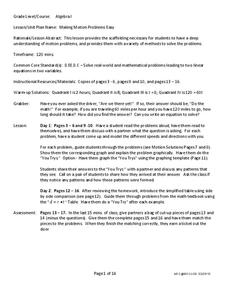
Motion Problems
Let's hope class participants don't get motion sickness. In the instructional activity, class members first solve motion problems using tables and graphs. They then use algebraic techniques to solve motion problems.
Curated OER
Identify and Graph Linear Equations
Students investigate linear functions. In this mathematics lesson plan, students plot points onto a graph by solving the equations y=x and y=mx+b by being given numbers for x and solving for y.
Alabama Learning Exchange
I Know What You Did Last Summer: A Data Graphing Project
Young scholars participate in graphing data. In this graphing data instructional activity, students make a stem and leaf plot of their summer activities. Young scholars create numerous graphs on poster boards. Students discuss the...
Curated OER
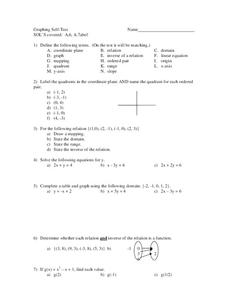
Graphing
In this graphing activity, 9th graders solve and graph 8 different problems that include defining various terms related to graphing. First, they label the quadrants in a coordinate plane and name the quadrant for each listed ordered...
Curated OER
Proportionality in Tables, Graphs, and Equations
Students create different methods to analyze their data. In this algebra lesson, students differentiate between proportion and non-proportional graph. They use the TI-Navigator to create the graphs and move them around to make their...
Wordpress
Introduction to Exponential Functions
This lesson begins with a review of linear functions and segues nicely over its fifteen examples and problems into a deep study of exponential functions. Linear and exponential growth are compared in an investment task. Data tables are...
Curated OER
Graphs and Equations
In this graphs and equations learning exercise, students solve and complete 5 various types of problems. First, they complete a table of values for a given quadratic function. Then, students use the graph to find an estimate for the...
Virginia Department of Education
Normal Distributions
Pupils work to find probabilities by using areas under the normal curve. Groups work to calculate z-scores and solve real-world problems using the empirical rule or tables.
EngageNY
Building Logarithmic Tables
Thank goodness we have calculators to compute logarithms. Pupils use calculators to create logarithmic tables to estimate values and use these tables to discover patterns (properties). The second half of the lesson has scholars use given...
Illustrative Mathematics
US Garbage, Version 1
An interesting example of a discrete function and how it is applies to the real world. This could easily make a good collaborative lesson with an environmental science class. Practice reading a table and drawing a scatter plot make up...
Mathematics Vision Project
Module 5: Features of Functions
The language and features of functions get careful treatment in a complex but doable lesson. Learners get a lot of practice really figuring out what a graph means in context, and also identifying key features of graphs. Key ideas like...
EngageNY
Graphing Cubic, Square Root, and Cube Root Functions
Is there a relationship between powers and roots? Here is a lesson that asks individuals to examine the graphical relationship. Pupils create a table of values and then graph a square root and quadratic equation. They repeat the process...
Curated OER
Graphing Systems of Inequalities
Solve equations and graph systems of inequalities. Designed as a lesson to reinforce these concepts, learners revisit shading and boundaries along with solving linear inequalities.
Curated OER
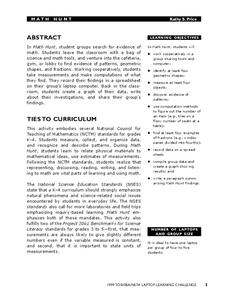
Math Hunt
Go on a scavenger hunt around your school to find evidence of math. Investigate different areas of your school for patterns, fractions, and different geometric shapes. Finally, create a spreadsheet and plot the data you've collected.
Curated OER
Writing Equations from a Table
Students use coordinates in a table to write equations. In this algebra lesson, students discuss rate of change as it relates to slope and x and y values. They plot the points from a table to graph their lines and write an equation for...
Curated OER
Making Logic Out of Madness
Tenth graders organize and interpret data from a student health program. For this physical education lesson, 10th graders use a body composition analyzer over 8 weeks to determine the validity of a student health program. Data obtained...
Curated OER
Rise Over Run
In this rise over run worksheet, learners solve and complete 2 different problems that include determining the rise over run for a race ran. First, they use the information in the table to graph each person's performance using a...
Curated OER
The Way to Better Grades!
Pupils collect and analyze data. In this statistics lesson, learners create a scatter plot from their collected data. They use, tables and graphs to analyze the data and mae decisions.
Mathematics Assessment Project
Sorting Functions
There's no sorting hat here. A high school assessment task prompts learners to analyze different types of functions. They investigate graphs, equations, tables, and verbal rules for four different functions.


