Curated OER
Creating Line Graphs
High schoolers draw line graphs. In this math lesson, students interpret minimum wage data and graph the data in a line graph. High schoolers predict the next minimum wage and figure the earnings for a 40 hour work week for someone...
Curated OER
Family Letter
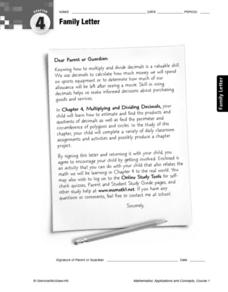
Middle schoolers, working with their parents, calculate and complete five word problems associated with multiplying and dividing decimals. Students research the current Federal minimum wage at the library or on the Internet.
Curated OER
Creating Line Graphs
Students relate data to coordinate graphs and plot points on this graph. They use minimum wage data to construct the graph. Students decide appropriate time intervals for the graphs. They share graphs with their classmates.


