Curated OER
Discovering Pi/Welcome to Pi Day
Students explore pi. In this circle measurement lesson plan, students define and identify radius, diameter, circumference, and perimeter. Students work in groups to measure several plastic lids and record their findings. Students compare...
Curated OER
Hey, Pythagoras! Help Me Understand Your Theorem!
Learners explore the Pythagorean Theorem. In this math lesson, pupils solve problems using the Pythagorean Theorem. They select the appropriate numbers to substitute in the formula to solve problems.
Shodor Education Foundation
Playing with Probability
Review basic probability concepts with your class using different-colored marbles in a bag. Then pair up learners and have them play a cool online interactive game in which they race miniature cars using the roll of a die or two. The...
EngageNY
More on Modeling Relationships with a Line
How do you create a residual plot? Work as a class and in small groups through the activity in order to learn how to build a residual plot. The activity builds upon previous learning on calculating residuals and serves as a precursor to...
EngageNY
Analyzing Residuals (Part 1)
Just how far off is the least squares line? Using a graphing calculator, individuals or pairs create residual plots in order to determine how well a best fit line models data. Three examples walk through the calculator procedure of...
Curated OER
Walk-A-Thon
Students graph linear http://www.lessonplanet.com/review?id=180542equations. For this problem solving lesson, students calculate slope and plot ordered pairs on a coordinate grid. Using a real-life example of a walk-a-thon, students...
Curated OER
How Much Is Too Much?
Students examine population growth and collect data. In this statistics lesson, students create a scatter plot to represent the different species found in the water and are being harvested. They graph their data and draw conclusion from it.
Curated OER
Probability and Applications of Simulations
Middle schoolers apply properties of probability to the real world. In this probability instructional activity, learners simulate the construction of empirical distribution. They collect and analyze data using central tendencies.
Curated OER
Quilting Geometry
Study geometry through the concept of quilt design. High schoolers examine the geometric shapes in various quilts and then create their own quilts using geometric shapes that fit together. In the end, they write a paragraph to describe...
Curated OER
Understanding Variables
Students solve linear equations and identify the unknown. In this algebra lesson, students define a variable and use addition, subtraction, multiplication and division to solve. They change the equation depending on the value of the...
Curated OER
Earthquake Patterns
Students identify and interpret the cyclical nature of the Parkfield, California earthquakes. They then investigate and graph earthquake occurrences on the Mojave segment of the San Andreas fault and then on the Hayward fault in order to...
Curated OER
Strike a Pose: Modeling in the Real World (There's Nothing to It!)
Adjust this lesson to fit either beginning or more advanced learners. Build a scatter plot, determine appropriate model (linear, quadratic, exponential), and then extend to evaluate the model with residuals. This problem uses real-world...
Curated OER
How Fast Is Fast?
Learners make sensible estimates and check the reasonableness of the answers. Students write and solve problems involving decimal multiplication and division. Learners perform calculations with time.
Curated OER
Build a Skittles Graph
Students construct a bar graph with a given set of data. They calculate the ratio and percent of the data. Students discuss alternate ways of graphing the data as well as multiple strategies to approach the task.
Curated OER
Buying on Credit
Students determine how buying on credit adds to the total cost of an item by computing the interest. They find a major item advertised in a magazine and identify the price. Then they identify the rate of a credit card and calculate the...
Curated OER
High Mountain Retreat
Students explore and analyze atmospheric conditions for a high mountain retreat. They examine the relationship between altitude, atmospheric pressure, temperature and humidity at a particular location. In addition, they write reports...
NASA
Solar Systems: Sequences and Probabilities
In this sequences and probability activity, students solve 3 problems by writing out all the possibilities for the solution and they use probability to find their answers. They determine the probability of solar flares happening on a...
Curated OER
Concept: What's The Chance?
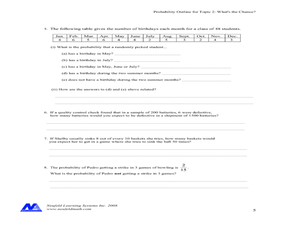
In this concept worksheet, students perform probability experiments. Using collected information, they interpret the data. Students answer questions about probability. This five-page worksheet contains approximately 15 multi-step...
Curated OER
Which Car Should I Buy?
Students use gas mileage of different cars to create T charts, algebraic equations, and graphs to show which gets better mileage. For this gas mileage lesson plan, students use the graph to see which car they should buy.
Curated OER
Here's Looking at You
Students assess some common inherited traits which are easily observable and note their phenotype for the trait. Students compare their phenotypes to those of their parents and attempt to describe the pattern and manor of inheritance.
Curated OER
Impact!!
Pupils perform a science experiment. In this algebra lesson, students collect data from their experiment and create a graph. They analyze the graph and draw conclusion.
Curated OER
What are My Chances?
Students calculate the chance of an event occurring. In this statistics lesson, students use combination and permutation to calculate the probability of an event occurring. They differentiate between theoretical and experimental...
Curated OER
Let's Take a Chance!
Students investigate probability and the chance of an even happening. In this algebra lesson, students incorporate their knowledge of probability to solve problems and relate it to the real world. They learn to make decisions based on data.
Curated OER
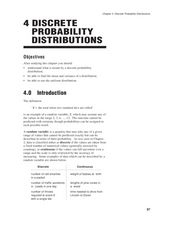
4 Discrete Probability Distributions
Students read and complete problems on how to solve discrete probability distributions. In this probability distributions lesson plan, students read math problem examples and solve them.
Other popular searches
- Predict Outcomes With Spinner
- Predict Outcomes Poetry
- Predict Outcomes Fiction
- Reading Predict Outcomes
- Predict Outcomes With Graphs


