Hi, what do you want to do?
Khan Academy
Khan Academy: Fitting Quadratic and Exponential Functions to Scatter Plots
Determine if a quadratic or exponential model fits a data set better, then use the model to make a prediction. Students receive immediate feedback and have the opportunity to try questions repeatedly, watch a video or receive hints.
Texas Instruments
Texas Instruments: Birthday Dot Plots
Using TI-Navigator, students' cursors become dots for a dot plot of what month they were born in.
Iowa State University
Iowa State Univ: Plotting Scatter Plot in X Gobi
Site explains how the XGobi computer program can be used to plot data in a scatter plot.
Texas Education Agency
Texas Gateway: Modeling Data With Linear Functions
Given a scatterplot where a linear function is the best fit, the student will interpret the slope and intercepts, determine an equation using two data points, identify the conditions under which the function is valid, and use the linear...
Texas Education Agency
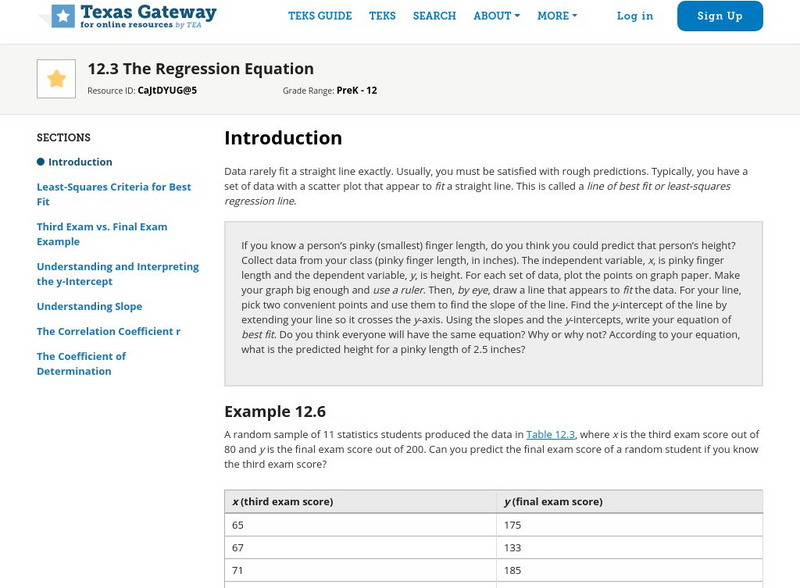
Texas Gateway: Tea Statistics: The Regression Equation
A tutorial on how to find the line of best fit or least-squares regression line for a set of data in a scatter plot using different methods and calculations.
University of Colorado
University of Colorado: Ph Et Interactive Simulations: Least Squares Regression
Create your own scatter plot or use real-world data and try to fit a line to it. Explore how individual data points affect the correlation coefficient and best-fit line.
Illustrative Mathematics
Illustrative Mathematics: S Id Coffee and Crime
This task addresses many standards regarding the description and analysis of bivariate quantitative data, including regression and correlation. Given a scatter plot, young scholars will answer a variety of questions about linear...
Varsity Tutors
Varsity Tutors: Hotmath: Algebra Review: Line Plot
Find a quick, concise explanation of a line plot. An example is given and clearly explained.
Shodor Education Foundation
Shodor Interactivate: Lesson: Stem and Leaf Plots
Lesson plan introduces students to stem-and-leaf plots. Many resources are available for student and teachers here.
Texas Instruments
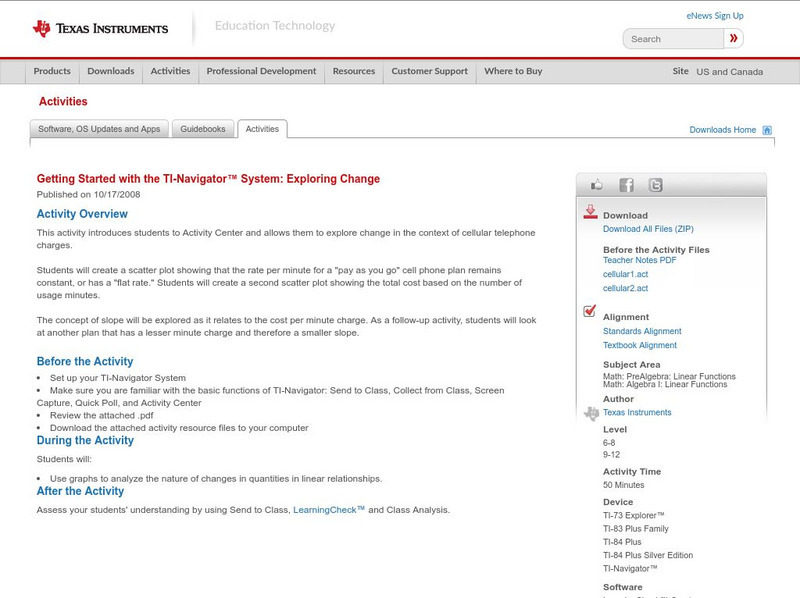
Texas Instruments: Getting Started With the Ti Navigator: Exploring Change
This activity introduces students to Activity Center. In this activity, students will explore change in the context of cellular telephone charges. Students will create a scatter plot showing that the rate per minute for a "pay as you go"...
Texas Instruments
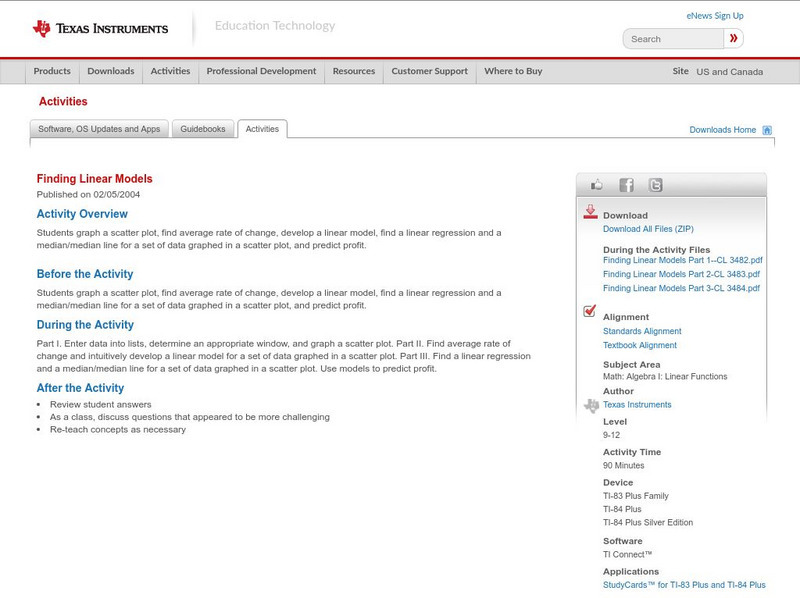
Texas Instruments: Finding Linear Models
Students graph a scatter plot, find average rate of change, develop a linear model, find a linear regression and a median/median line for a set of data graphed in a scatter plot and predict profit.
Texas Instruments
Texas Instruments: Math Today Is Leisure Time Really Shrinking?
Students will have the opportunity to organize data from the USA TODAY Snapshot "Is leisure time really shrinking?" into two scatter plots and determine the quadratic model for each scatter plot.
Illustrative Mathematics
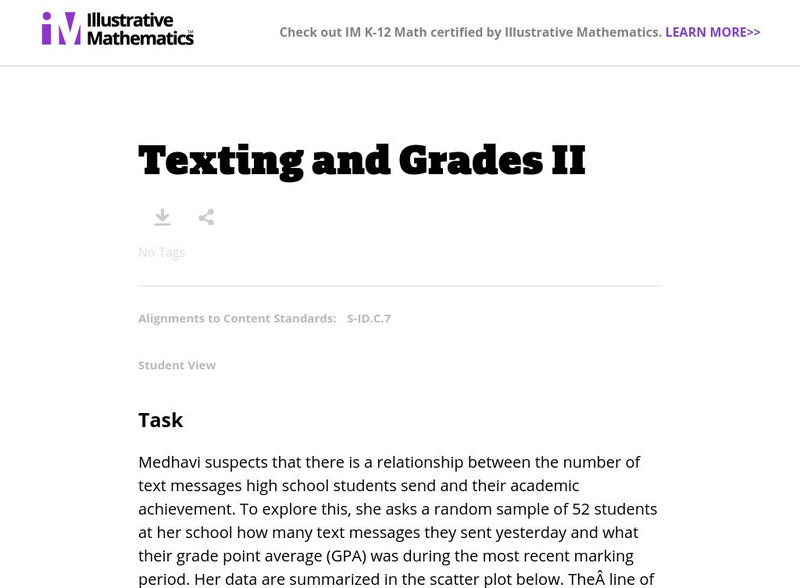
Illustrative Mathematics: S Id.7 Texting and Grades
Medhavi suspects that there is a relationship between the number of text messages high school students send and their academic achievement. To explore this, she asks a random sample of 52 students at her school how many text messages...
Texas Instruments
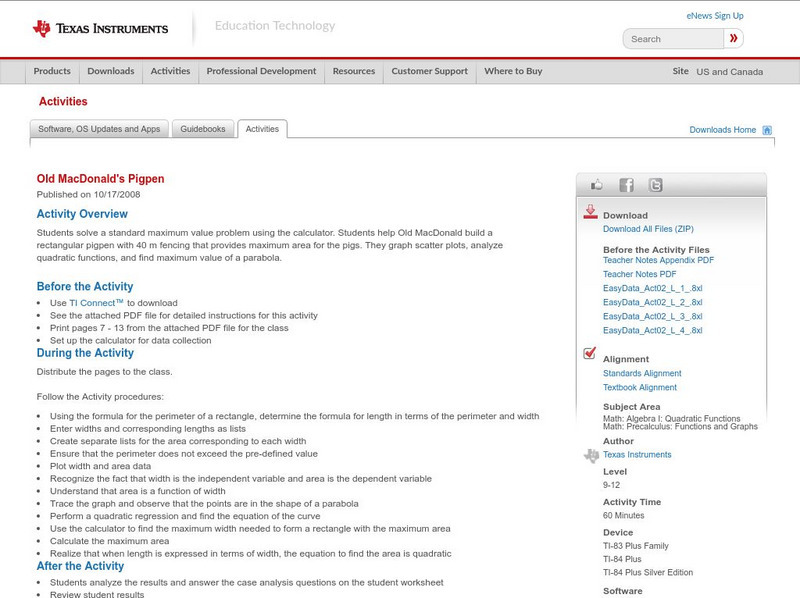
Texas Instruments: Old Mac Donald's Pigpen
In this activity, students solve a standard maximum value problem using the calculator. Students help Old MacDonald build a rectangular pigpen with 40 m fencing that provides maximum area for the pigs. They graph scatter plots, analyze...
Texas Instruments
Texas Instruments: Math Today More of Us
In this activity students will investigate exponential functions and their graphs using real-life data. Students will analyze population data for the United States and create an exponential model for the scatter plot.
Texas Instruments
Texas Instruments: Exponential Growth Experiment
Students will work in pairs and will conduct a growth experiment. They will record their answers for 7 to 10 trials. They will make a scatterplot of their data and share their graphs with the class.
Texas Instruments
Texas Instruments: Is There a Limit?
In this activity, students examine data about bacteria and their growth. They produce a scatter plot, a best-fit model, and draw conclusions based on the data and graph.
Texas Instruments
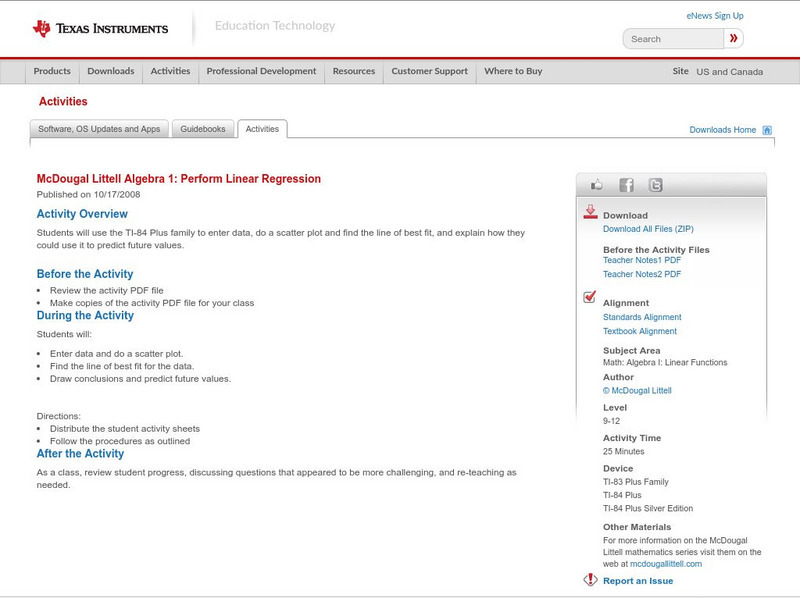
Texas Instruments: Mc Dougal Littell Algebra 1: Perform Linear Regression
Students can use the TI-84 Plus family to enter data, do a scatter plot and find the line of best fit and explain how they could use it to predict future values.
Texas Instruments
Texas Instruments: Math Today: Internet Subscribers Soar
Students will create a scatter plot of the number of Internet subscribers during 2004 through 2008 using the USA TODAY Snapshot "Internet phone subscribers soar." This activity will allow students to explore real-life data that will be...
Texas Instruments
Texas Instruments: Shoe Size vs Height
Students will be sent empty lists and need to send back their shoe size and height in inches. TI-Navigator will compile all lists and send compiled list to students. Students will then use the compiled list to make scatterplot and find...
Texas Instruments
Texas Instruments: Inverse of Two Temps
In this activity, students find a conversion equation that will calculate the corresponding Celsius temperature for any given Fahrenheit temperature. Students learn to graph scatter plots, analyze and graph linear equations, compute and...
Texas Instruments
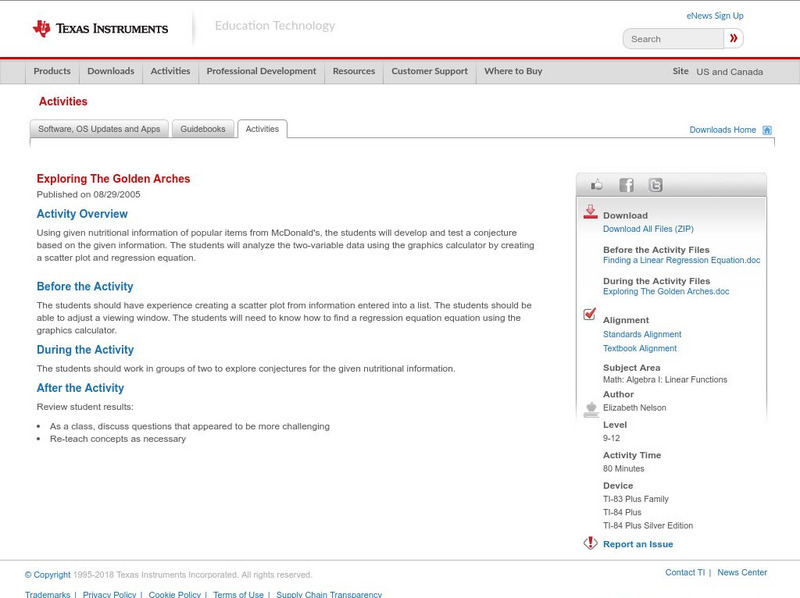
Texas Instruments: Exploring the Golden Arches
Using given nutritional information of popular items from McDonald's, the students will develop and test a conjecture based on the given information. The students will analyze the two-variable data using the graphics calculator by...
Texas Instruments
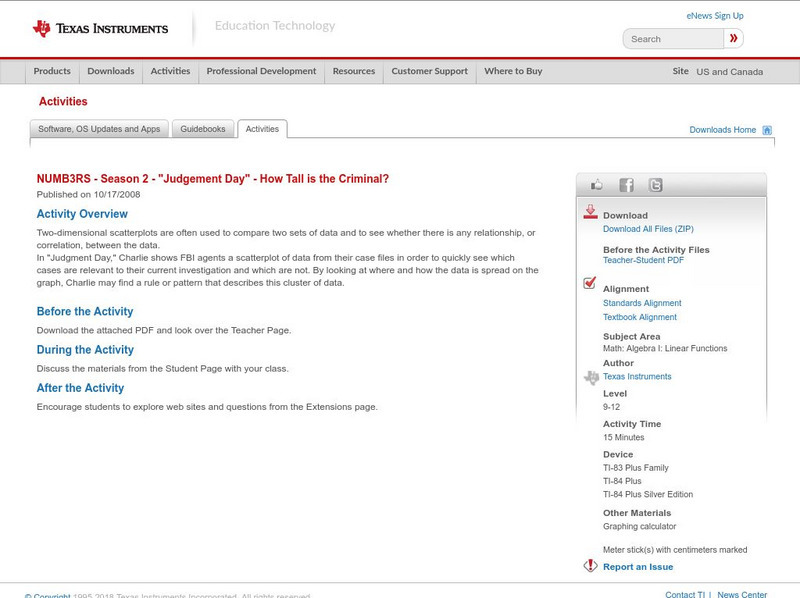
Texas Instruments: Numb3 Rs: How Tall Is the Criminal?
Based off of the hit television show NUMB3RS, this lesson introduces students to lines of best fit and their applications. While the extensions delve into correlation, the main lesson focuses only on collecting data, creating a...
Other popular searches
- Math Scatter Plots
- Algebra Scatter Plots
- Creating Scatter Plots
- Candy Scatter Plots
- Data for Scatter Plots
- Pre Algebra/ Scatter Plots
- Interpreting Scatter Plots
- Prue Algebra/ Scatter Plots
- Halloween Scatter Plots
- Scatter Plots and Correlation
- Pr Algebra/ Scatter Plots
- Scatter Plots Ti 83


