Hi, what do you want to do?
National Council of Teachers of Mathematics
Nctm: Illuminations: Mean and Median
This applet allows the user to investigate the mean, median, and box-and-whisker plot for a set of data that they create.
Alabama Learning Exchange
Alex: Box and Whisker With a Bed Sheet
The class will make a list of all of their classmates heights, ages in months, and shoe sizes. They will then use this data to create a human box-and-whisker plot. This lesson plan was created as a result of the Girls Engaged in Math and...
Oswego City School District
Regents Exam Prep Center: Displaying Data
Use this lesson, practice exercise, and teacher resource in planning instruction on displaying data. In the lessons, you'll find definitions and examples of ways to collect and organize data, quartiles, and box-and-whisker plots, as well...
Shodor Education Foundation
Shodor Interactivate: Lesson: Algorithm Discovery With Venn Diagrams
The lesson plan, with objectives, lesson outline, and interactive resources, helps students learn about algorithms using box plots and Venn diagrams.
Oswego City School District
Regents Exam Prep Center: Practice With Organizing and Interpreting Data
Several problems are presented to test your skills in creating and interpreting frequency tables, pie charts, box-and-whisker and stem-and-leaf plots.
Texas Instruments
Texas Instruments: Car Sales
In this activity, students will create a box and whisker plot using a list. The list will be sent using TI-Navigator and contains the number of car sales since 1970. They will determine the values in the box plot and answer some...
Texas Instruments
Texas Instruments: Measures of Central Tendency Activity: Height of the Class
The purpose of this lesson is to have students create a box and whiskers plot from collecting class data of each person's height.
Texas Instruments
Texas Instruments: Measures of Central Tendency
Mean, median, and mode are measures of central tendency in data analysis. Each can be used to identify central tendency. Box-and-whiskers plots are a visual representation of collected data involving medians.
Texas Instruments
Texas Instruments: Numb3 Rs: "Take Out" Outliers
Based off of the hit television show NUMB3RS, this lesson has students create box-and-whisker plots for given data, and then determine which (if any) data points are outliers. Students determine outliers through two methods in this...
Texas Instruments
Texas Instruments: Numb3 Rs: Stylometry
Based off of the hit television show NUMB3RS, this lesson has students analyze two samples of writing to determine who is the author of a third piece of writing. While the actual statistics would be overwhelming for students, this lesson...
Texas Instruments
Texas Instruments: How Tall? Describing Data With Statistical Plots
In this activity, students' will measure their heights using a motion detector and describe the data using the statistical concept called box plot.
Texas Instruments
Texas Instruments: How Many States Have You Visited?
This is a beginner activity for students Using the TI-84. Students will collect data from the class and create a Box & Whisker plot based on how many States students have visited. This is easy for the teacher to learn, and steps are...
Other
College of Natural Sciences: Measures of Location
Different measures of location are discussed in terms of box and whisker plots.
University of South Florida
Fcat: Drops on a Penny: Teacher Notes
Students learn how to create stem-and-leaf diagrams and boxplots by collecting data on the surface tension of water molecules. This hands-on activity using pennies is a great way to learn how to organize data.
Cuemath
Cuemath: Outlier
A comprehensive guide for exploring the topic of outliers with definitions, what is an outlier, how to find outliers using the turkey method and the interquartile range, solved examples, and interactive questions.
Texas Instruments
Texas Instruments: Get on the Stick
In this activity, students use a CBR 2 to measure the reaction time of catching a stick. They also learn how to interpret a box plot, and make a five number summary of a single variable data set.
Oswego City School District
Regents Exam Prep Center: Categorizing Data
Three lessons on different types of data (qualitative, quantitative, univariate, bivariate, biased data) as well as a practice activity and teacher resource.
Richland Community College
Richland College: Ti 82 Histograms / Box Plots
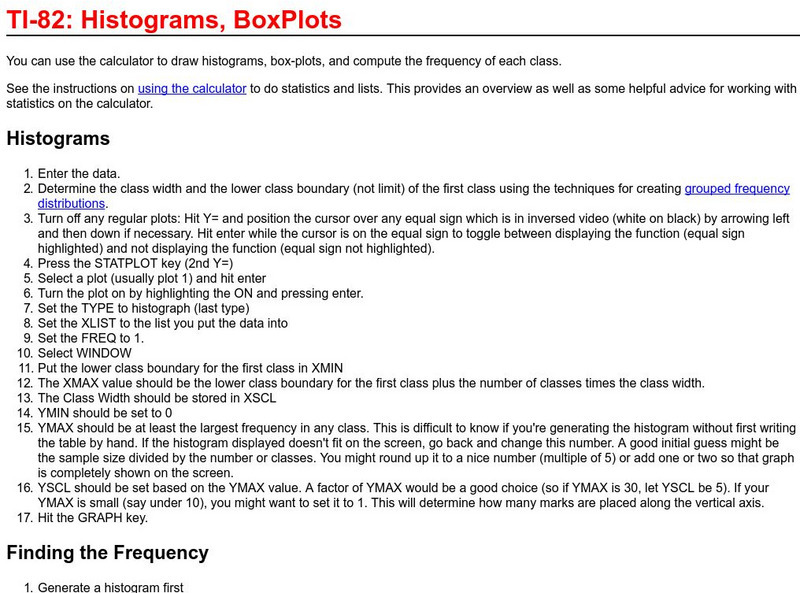
Richland College provides a step-by-step procedure on how to use a TI-82 to construct histograms and box plots and then use this to find frequency distribution.
Other
Nearpod: Introduction to Data Representation
In this lesson on representation data, students explore how to make dot plots, histograms, and box plots and learn about outliers in a data set.
Other
Stat Soft: Statistics Glossary
Dozens of statistical terms are defined and illustrated in this glossary.


