Hi, what do you want to do?
Math Is Fun
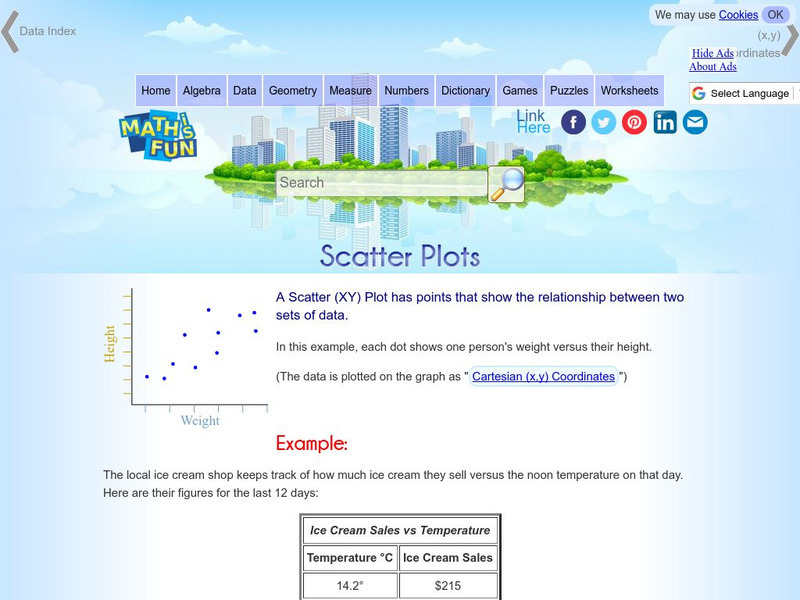
Math Is Fun: Scatter Plots
Explains, with examples, what scatter plots are and how to interpret the data. Discusses trends, interpolation and extrapolation, and correlation. Includes a set of practice questions.
University of Colorado
University of Colorado: Ph Et Interactive Simulations: Least Squares Regression
Create your own scatter plot or use real-world data and try to fit a line to it. Explore how individual data points affect the correlation coefficient and best-fit line.
Texas Education Agency
Texas Gateway: Collecting Data and Making Predictions
Given an experimental situation, the student will write linear functions that provide a reasonable fit to data to estimate the solutions and make predictions.
Other
Online Statistics Education: Graphing Distributions [Pdf]
This is the second chapter of a statistics e-text developed collaboratively by Rice University, University of Houston Clear Lake, and Tufts University. It looks at many different types of data displays and the advantages and...
Cuemath
Cuemath: Line Graphs
A comprehensive guide for learning all about line graphs with definitions, their sections, how to read and create graphs, solved examples, and practice questions.
National Council of Teachers of Mathematics
Nctm: Illuminations: Line of Best Fit
Use this activity to practice how to enter a set of data, plot the data on a coordinate grid, and determine the equation for a line of best fit.
Math Planet
Math Planet: Stem and Leaf Plots and Box and Whiskers Plot
Discover how to use stem-and-leaf plots and box-and-whisker plots to visualize data by taking a look at examples and a video lesson.
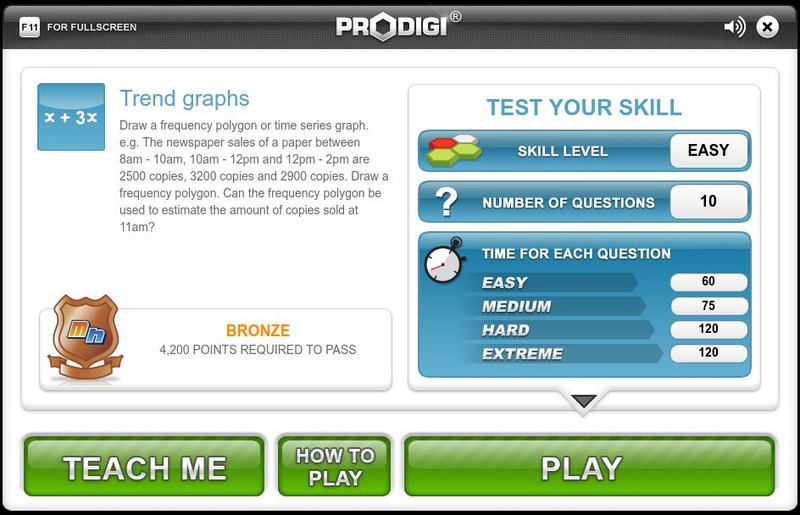
Mangahigh
Mangahigh: Data: Trend Graphs
Students explore the concept of frequency trend graphs by working through an online tutorial and then attempting a ten question quiz that increases in difficulty as questions are answered correctly.
Other
Nearpod: Scatterplots, Correlation & Lines of Best Fit
In this lesson on scatterplots, students will learn how to create the line of best fit and analyze scatterplots by learning about correlations and causation.
University of Illinois
University of Illinois: Line Graphs
Line graphs are shown and explained here. You can learn what kind of data is best represented using a line graph. There are also line graphs with questions and answers available to help you learn how to read them.
Discovery Education
Discovery Education: Web Math: Using a Number Line
This WebMath site provides an interactive number line "solver." Content includes helpful hint and a full explanation of the mathematical solution.
Illustrative Mathematics
Illustrative Mathematics: S Id Coffee and Crime
This task addresses many standards regarding the description and analysis of bivariate quantitative data, including regression and correlation. Given a scatter plot, young scholars will answer a variety of questions about linear...
University of Georgia
University of Georgia: Inter Math: Box and Whisker Plot
Description of box-and-whisker plots and their uses, along with a visual representation. There are links to related terms, everyday examples, more information, and the interactive checkpoint involving box and whisker plots located in the...
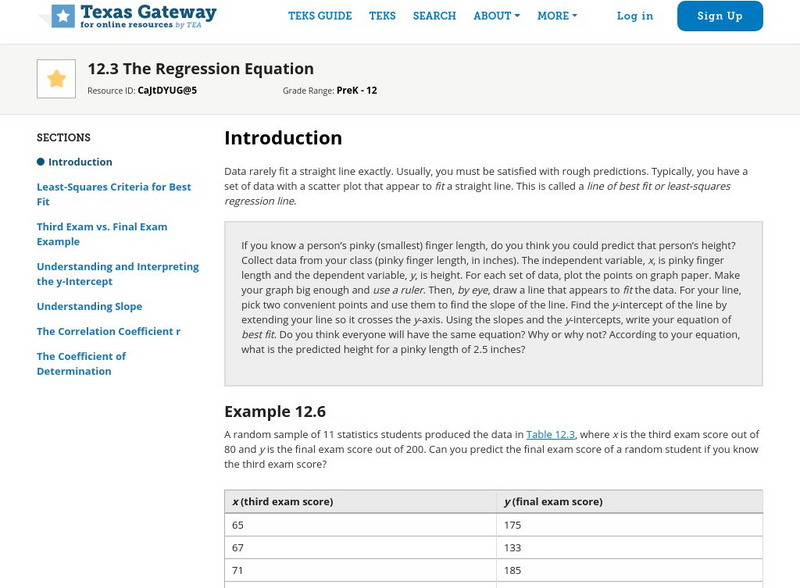
Texas Education Agency
Texas Gateway: Tea Statistics: The Regression Equation
A tutorial on how to find the line of best fit or least-squares regression line for a set of data in a scatter plot using different methods and calculations.
University of South Florida
Florida Center for Instructional Tech: Famous People
Students estimate the ages of famous people, then create a scatterplot with the actual ages. This activity allows them to estimate with linear equations. You can access the age data through the "activity" link.
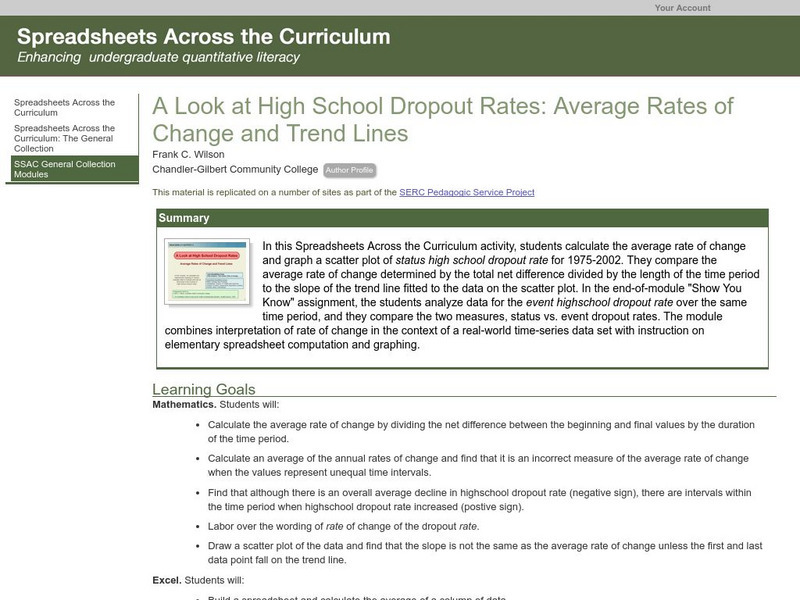
Science Education Resource Center at Carleton College
Serc: Average Rates of Change and Trend Lines
In this Spreadsheets Across the Curriculum activity, students calculate the average rate of change and graph a scatter plot of status high school dropout rate for 1975-2002. The module combines interpretation of rate of change in the...
PBS
Pbs Teachers: Galileo's Battle for the Heavens Plotting Sun Spots
In this activity, students follow in Galileo's footsteps as they examine the nature of sunspot cycles, define solar minimum and solar maximum, and graph data for a solar cycle. Then they will predict the next solar maximum and when the...
Math Drills
Math Drills: Statistics and Probability Worksheets
Download these free worksheets to sharpen your skills with statistics and probability. Sheets focus on collecting and organizing data, measures of central tendency (mean, median, mode, and range), and probability.
National Council of Teachers of Mathematics
The Math Forum: Chameleon Graphing: Coordinate Plane
Dive into this introduction to graphing in the coordinate plane, and meet a chameleon named Sam. Sam will help guide you through graphing points on a line, using negative numbers, and graphing points in the coordinate plane.
Math Graphs
Houghton Mifflin: Math Graphs: Line of Best Fit 3 [Pdf]
Students sketch the line that best approximates the data in a scatter plot. The scatter plot is available in PDF format.
Math Graphs
Houghton Mifflin: Math Graphs: Line of Best Fit 4 [Pdf]
Students sketch the line that best approximates the data in a scatter plot. The scatter plot is available in PDF format.
Cuemath
Cuemath: Linear Graph
A comprehensive guide for learning all about linear graphs with definitions, properties, their equations, how to plot or analyze them, solved examples, and practice questions.
Texas Instruments
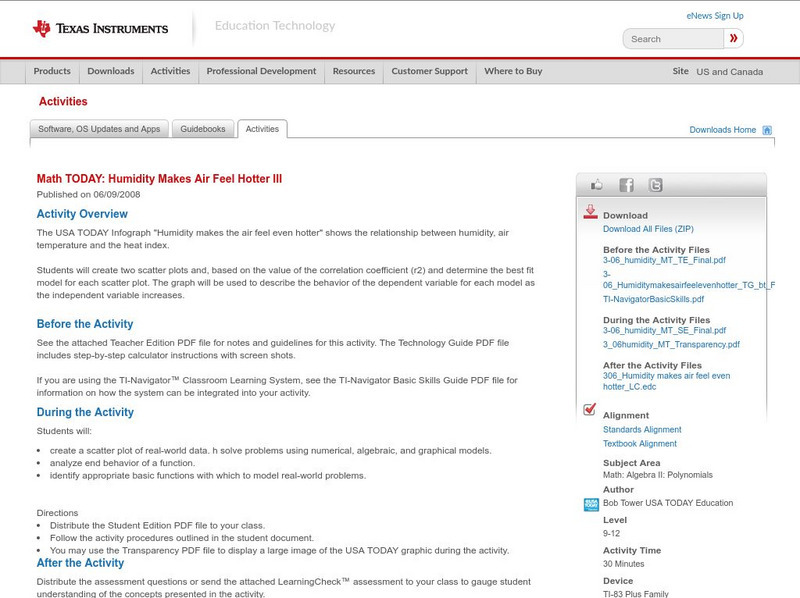
Texas Instruments: Math Today: Humidity Makes Air Feel Hotter Iii
Investigate the relationship among humidity, air temperature, and the heat index while learning about modeling data, evaluating functions, and describing the end behavior of a function. Students will use graphing calculator technology to...
Texas Instruments
Texas Instruments: Boat Registration and Manatee Deaths in Florida
Students will explore the data on boat registrations and manatee deaths in Florida. They will use the data, the graph of the data and the line of best fit to make predictions about the relationship of the data.




![Online Statistics Education: Graphing Distributions [Pdf] eBook Online Statistics Education: Graphing Distributions [Pdf] eBook](https://static.lp.lexp.cloud/images/attachment_defaults/resource/large/FPO-knovation.png)

