Khan Academy
Khan Academy: Scatterplots and Correlation Review
A scatterplot is a type of data display that shows the relationship between two numerical variables. Each member of the dataset gets plotted as a point whose x-y coordinates relates to its values for the two variables.
Khan Academy
Khan Academy: Describing Scatterplots (Form, Direction, Strength, Outliers)
Description and example of a scatter plot.
BSCS Science Learning
Bscs: Budburst Lilac Festival
In this Inquiry, students predict the best date to host a lilac blossom festival so that lilacs are in full bloom in the city where students live. Students are introduced to Project Budburst, a citizen science project in which volunteers...
Texas Instruments
Texas Instruments: Boat Registration and Manatee Deaths in Florida
Students will explore the data on boat registrations and manatee deaths in Florida. They will use the data, the graph of the data and the line of best fit to make predictions about the relationship of the data.
Alabama Learning Exchange
Alex: My Peanut Butter Is Better Than Yours!
The students will engage in the process of statistical data comparing data using tables and scatterplots. The students will compare data using measures of center (mean and median) and measures of spread (range). This lesson can be done...
Texas Instruments
Texas Instruments: Is There a Limit?
In this activity, students examine data about bacteria and their growth. They produce a scatter plot, a best-fit model, and draw conclusions based on the data and graph.
Texas Instruments
Texas Instruments: Exploring the Golden Arches
Using given nutritional information of popular items from McDonald's, the students will develop and test a conjecture based on the given information. The students will analyze the two-variable data using the graphics calculator by...
Texas Instruments
Texas Instruments: Finding Linear Models
Students graph a scatter plot, find average rate of change, develop a linear model, find a linear regression and a median/median line for a set of data graphed in a scatter plot and predict profit.
Texas Instruments
Texas Instruments: Math Today Is Leisure Time Really Shrinking?
Students will have the opportunity to organize data from the USA TODAY Snapshot "Is leisure time really shrinking?" into two scatter plots and determine the quadratic model for each scatter plot.
Illustrative Mathematics
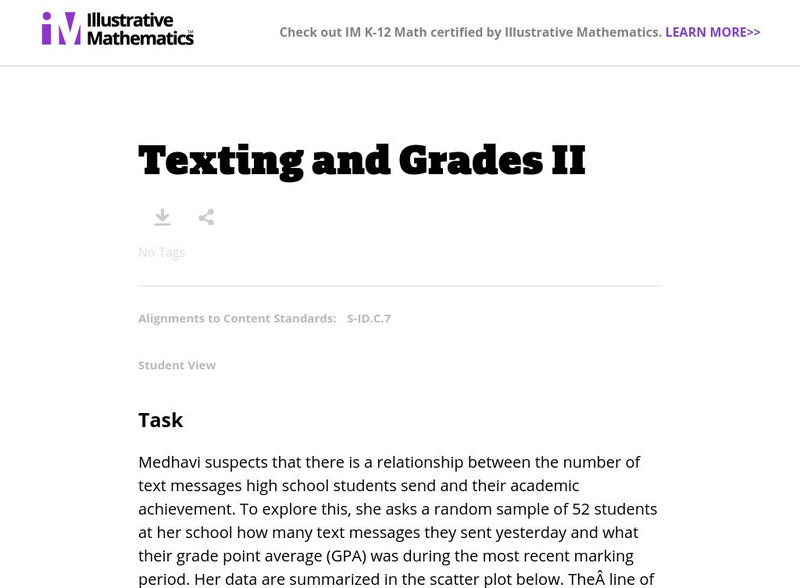
Illustrative Mathematics: S Id.7 Texting and Grades
Medhavi suspects that there is a relationship between the number of text messages high school students send and their academic achievement. To explore this, she asks a random sample of 52 students at her school how many text messages...
Texas Instruments
Texas Instruments: Exponential Growth Experiment
Students will work in pairs and will conduct a growth experiment. They will record their answers for 7 to 10 trials. They will make a scatterplot of their data and share their graphs with the class.
Texas Instruments
Texas Instruments: Mc Dougal Littell Algebra 1: Perform Linear Regression
Students can use the TI-84 Plus family to enter data, do a scatter plot and find the line of best fit and explain how they could use it to predict future values.
Texas Instruments
Texas Instruments: Math Today: Internet Subscribers Soar
Students will create a scatter plot of the number of Internet subscribers during 2004 through 2008 using the USA TODAY Snapshot "Internet phone subscribers soar." This activity will allow students to explore real-life data that will be...
Texas Instruments
Texas Instruments: Inverse of Two Temps
In this activity, students find a conversion equation that will calculate the corresponding Celsius temperature for any given Fahrenheit temperature. Students learn to graph scatter plots, analyze and graph linear equations, compute and...
Texas Instruments
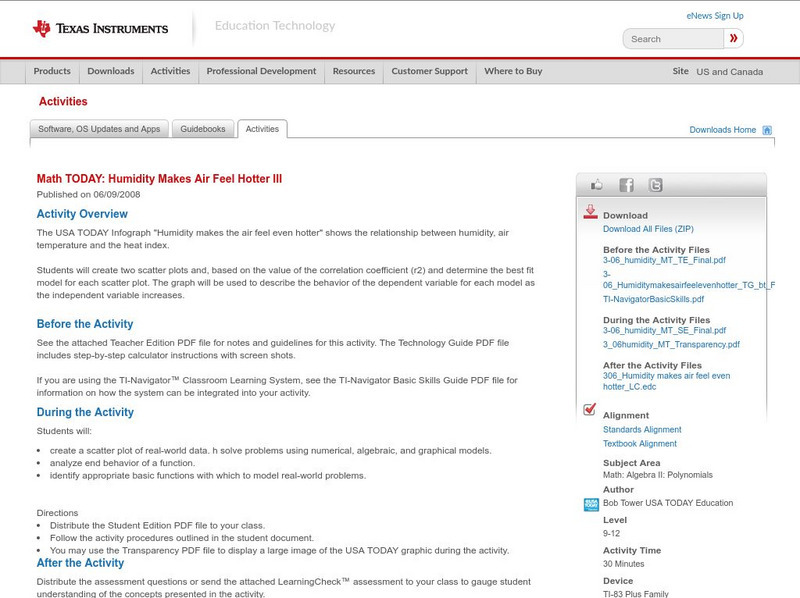
Texas Instruments: Math Today: Humidity Makes Air Feel Hotter Iii
Investigate the relationship among humidity, air temperature, and the heat index while learning about modeling data, evaluating functions, and describing the end behavior of a function. Students will use graphing calculator technology to...
Alabama Learning Exchange
Alex: Statistically Thinking
The object of this project is for learners to learn how to find univariate and bivariate statistics for sets of data. Also, the students will be able to determine if two sets of data are linearly correlated and to what degree. The...
Texas Instruments
Texas Instruments: Numb3 Rs: Dialing Ben
Based off of the hit television show NUMB3RS, this lesson has students try to discover if there has been a significant change in cell phone use over the course of ten days. If so, this "change point" can be detected by creating a line of...
Rice University
Rice University: The Hand Squeeze
Students will enjoy this data collection and class analysis experiment involving the time it takes for a hand squeeze to travel around a circle of people. From organizing the activity to collecting the data to making a table and graphing...
Texas Instruments
Texas Instruments: Nevada's Population
In this activity, students examine patterns and use these patterns to try to predict different aspects of an event. They study the statistical patterns for the population of the state of Nevada over a period of hundred years, and predict...
Texas Instruments
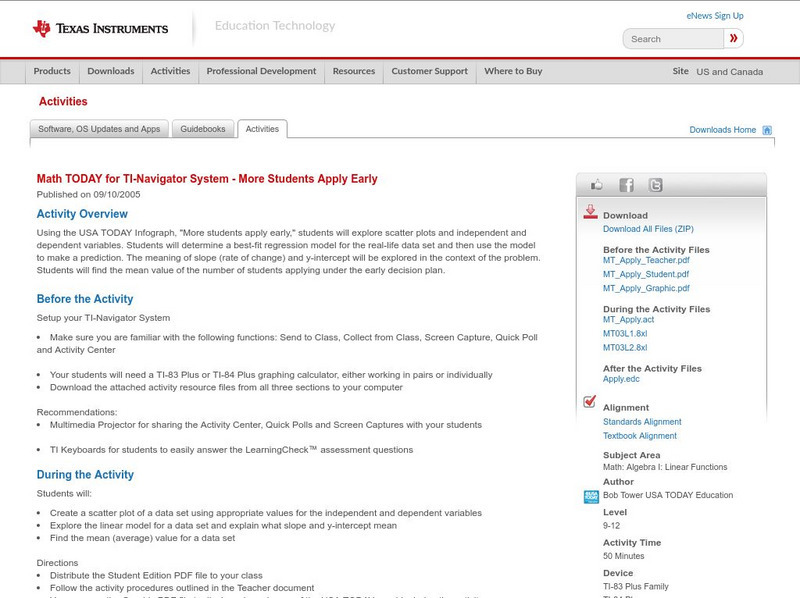
Texas Instruments: Math Today for Ti Navigator System: More Students Apply Early
Using the USA TODAY Infograph, "More students apply early," students will explore scatter plots and independent and dependent variables. Students will determine a best-fit regression model for the real-life data set and then use the...
Texas Instruments
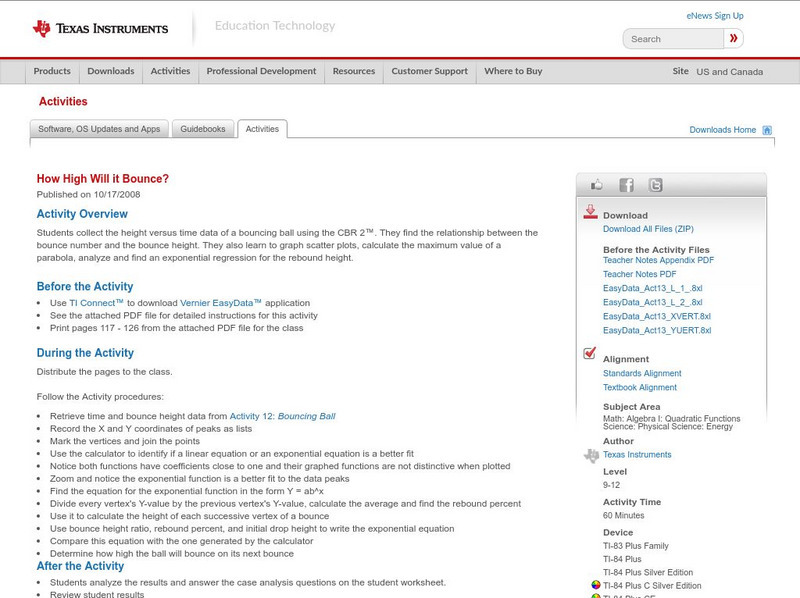
Texas Instruments: How High Will It Bounce?
In this activity, students collect the height versus time data of a bouncing ball using the CBR 2. They find the relationship between the bounce number and the bounce height. They learn to graph scatter plots, calculate the maximum value...
Texas Instruments
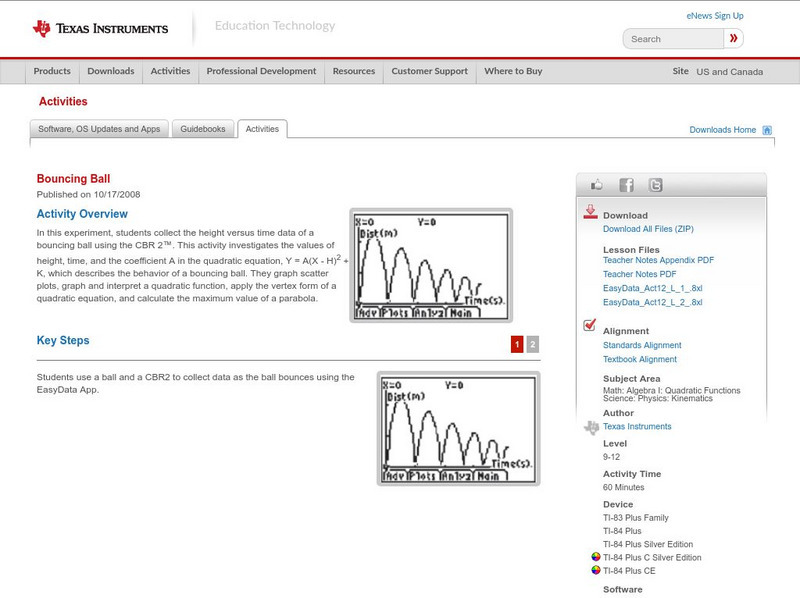
Texas Instruments: Bouncing Ball
In this experiment, students collect the height versus time data of a bouncing ball using the CBR 2. This activity investigates the values of height, time, and the coefficient A in the quadratic equation, which describes the behavior of...
Texas Instruments
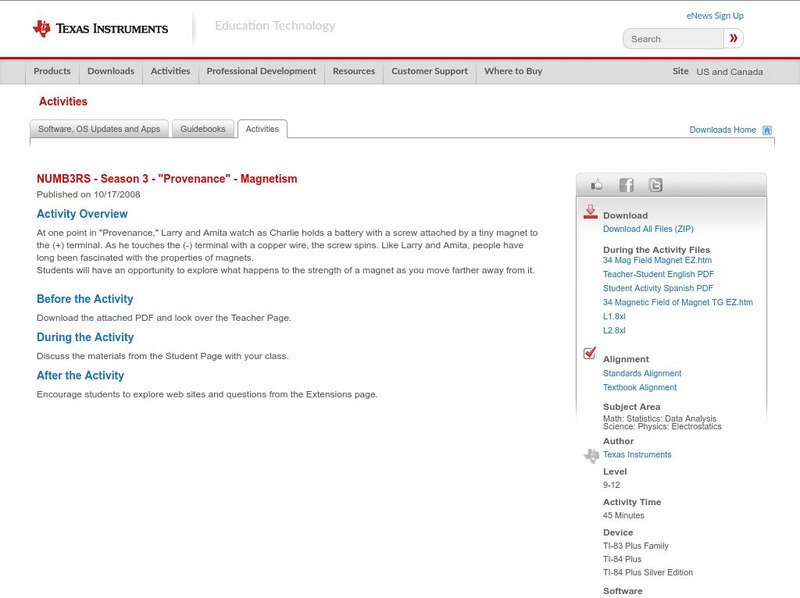
Texas Instruments: Numb3 Rs: Magnetism
Based off of the hit television show NUMB3RS, this lesson, designed for upper-level high school students, has students linearize the data describing the force of a magnet at various distances. While it is assumed students already know...


