Curated OER
Price of Apples- Linear Data
Students collect data and create a graph. In this algebra lesson, students describe functions graphically, algebraically and verbally. They identify functions as being independent and dependent using variables.
Curated OER
Analyzing Graphs and Data
Students collect and analyze data. In this statistics lesson, students graph their data and make inferences from the collected data. They display their data using graphs, bar graphs, circles graphs and Venn diagrams.
Curated OER
Graphing Data from the Chemistry Laboratory
High schoolers graph and analyze data using a spreadsheet.
Curated OER
Modeling Population Growth
Students collect data on population growth. In this statistics lesson, students graph their data and make predictions. They find the linear regression and the best fit line.
Curated OER
Comparison of Two Different Gender Sports Teams - Part 1 of 3 Measures of Central Tendency
Young scholars gather and analyze data from sports teams. In this measures of central tendency lesson, students gather information from websites about sports team performance. Young scholars analyze and draw conclusions from this data....
Curated OER
Model Data with Quadratic Functions
Students model data using quadratic equations. In this algebra lesson, students simplify and factor quadratic equations. They graph the function using collected data and analyze the parabola.
Curated OER
The Environment and Interactions of Living Organisms
Young scholars study the environment and interactions of living organisms. They identify abiotic and biotic factors and create a foldable and vocabulary cards. They create a poster illustrating soil and watch a video to study symbiosis.
Curated OER
Linear Modeling: Functions
Students analyze linear functions. In this algebra lesson, students create a linear model to relate coordinate pairs. They evaluate and solve equations.
Curated OER
The Box Problem
Students create graphic, algebraic and verbal ideas of functions. In this algebra lesson, students graph functions and identify the zeros of the functions. They find the domain and range and classify functions as relation or not.
Curated OER
What's The Point?
Students solve word problems using the correct math symbols. For this algebra lesson, students use the TI calculator to graph their equation and analyze it. They find the line of regression and use to draw conclusion.
Math Is Fun
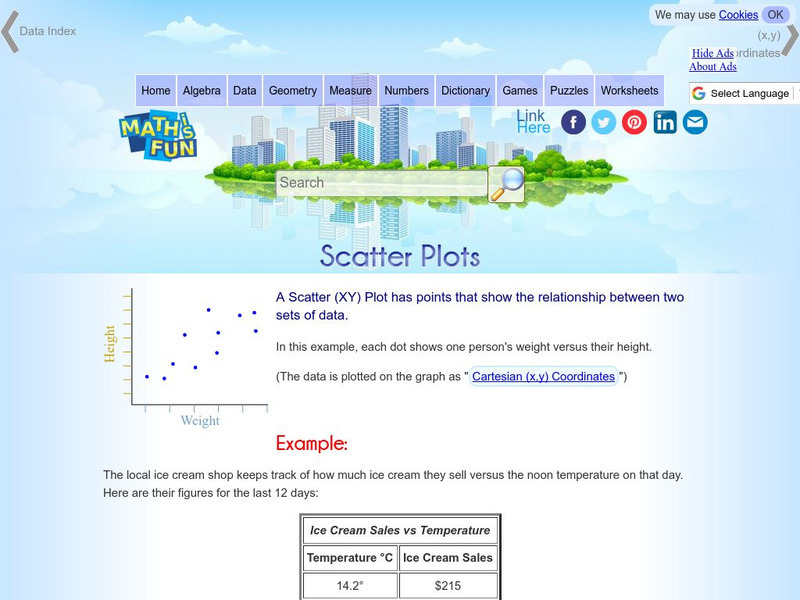
Math Is Fun: Scatter Plots
Explains, with examples, what scatter plots are and how to interpret the data. Discusses trends, interpolation and extrapolation, and correlation. Includes a set of practice questions.
Khan Academy
Khan Academy: Review: Outliers in Scatter Plots
Learn about the points that don't fit the pattern in a scatter plot with this article. Site also includes practice questions to test your knowledge of the topic.
Khan Academy
Khan Academy: Review: Clusters in Scatter Plots
An article that discusses what we mean when we talk about clusters in scatter plots. It also includes practice questions that test your knowledge of the topic.
Texas Education Agency
Texas Gateway: Modeling Data With Linear Functions
Given a scatterplot where a linear function is the best fit, the student will interpret the slope and intercepts, determine an equation using two data points, identify the conditions under which the function is valid, and use the linear...
Texas Education Agency
Texas Gateway: Interpreting Scatterplots
Given scatterplots that represent problem situations, the student will determine if the data has strong vs weak correlation as well as positive, negative, or no correlation.
Texas Instruments
Texas Instruments: Nevada's Population
In this activity, students examine patterns and use these patterns to try to predict different aspects of an event. They study the statistical patterns for the population of the state of Nevada over a period of hundred years, and predict...
Texas Instruments
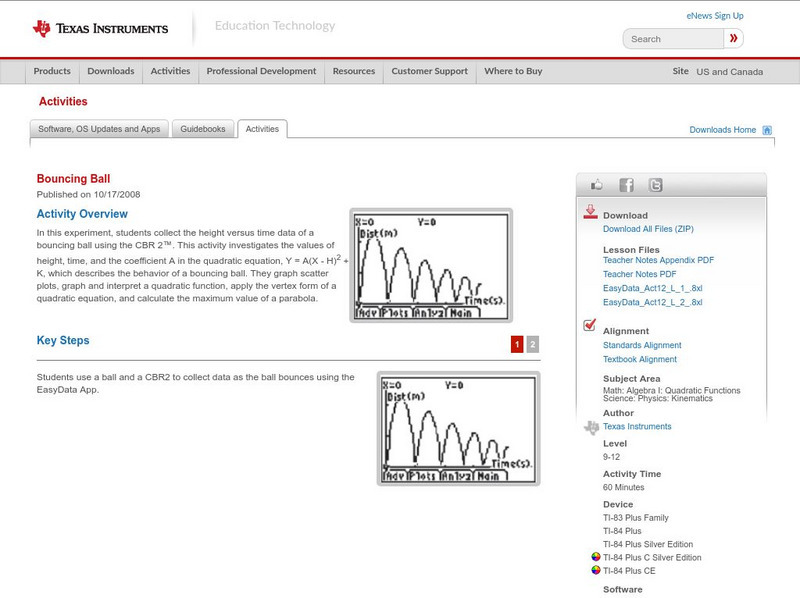
Texas Instruments: Bouncing Ball
In this experiment, students collect the height versus time data of a bouncing ball using the CBR 2. This activity investigates the values of height, time, and the coefficient A in the quadratic equation, which describes the behavior of...
Texas Instruments
Texas Instruments: Bivariate Data
This set contains statistics questions regarding bivariate data: scatter plots, the least-squares regression line, and their interpretation. The student is asked about the meaning of the various strengths and directions of linear...
Texas Instruments
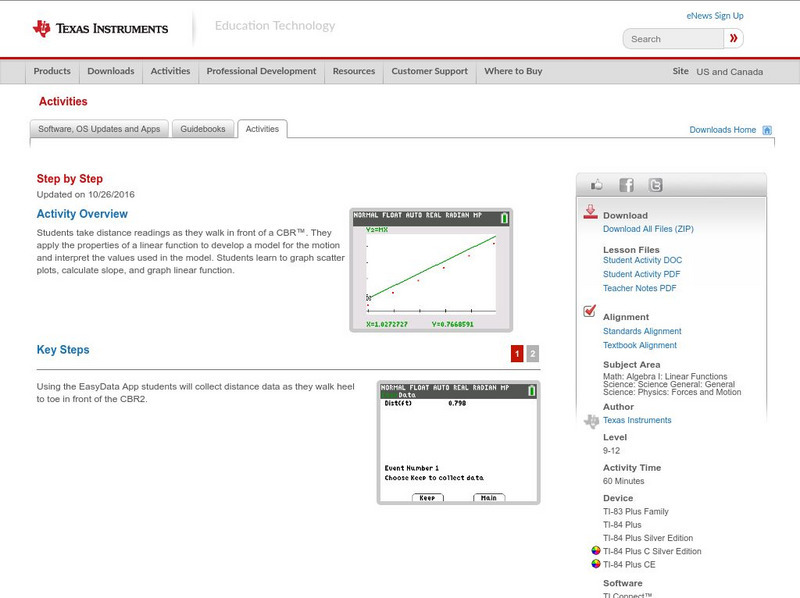
Texas Instruments: Step by Step
In this activity, students take distance readings as they walk in front of a CBR. They apply the properties of a linear function to develop a model for the motion and interpret the values used in the model. Students learn to graph...
Science Education Resource Center at Carleton College
Serc: Average Rates of Change and Trend Lines
In this Spreadsheets Across the Curriculum activity, students calculate the average rate of change and graph a scatter plot of status high school dropout rate for 1975-2002. The module combines interpretation of rate of change in the...


