Hi, what do you want to do?
CK-12 Foundation
Ck 12: Algebra: Applications of Function Models
[Free Registration/Login may be required to access all resource tools.] In this lesson students draw a scatter plot of data, find and draw the function that best fits that data, and make predictions from that information. Students watch...
University of Regina (Canada)
University of Regina: Math Central: Graphing Activities
Eighteen different graphing activities will teach students how to plot points, draw lines, compare graphs, and problem solve.
Texas Instruments
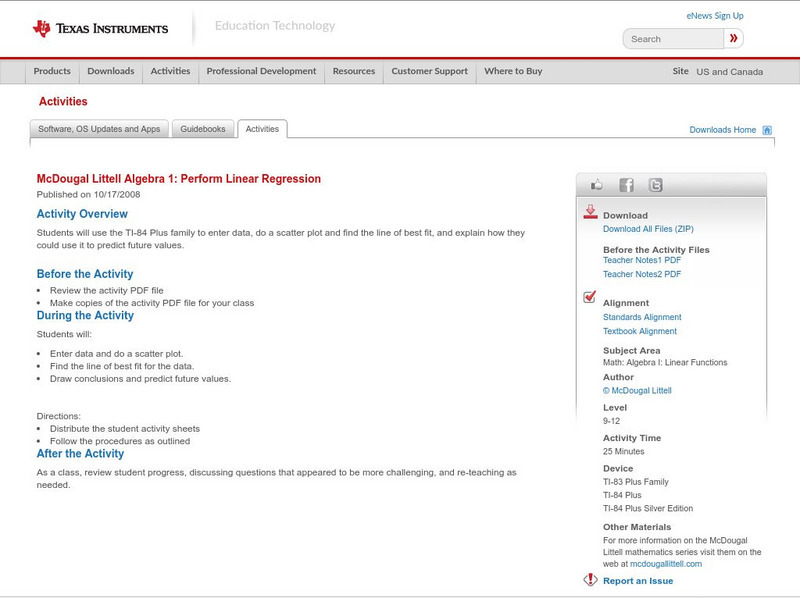
Texas Instruments: Mc Dougal Littell Algebra 1: Perform Linear Regression
Students can use the TI-84 Plus family to enter data, do a scatter plot and find the line of best fit and explain how they could use it to predict future values.
Texas Instruments
Texas Instruments: Bivariate Data
This set contains statistics questions regarding bivariate data: scatter plots, the least-squares regression line, and their interpretation. The student is asked about the meaning of the various strengths and directions of linear...
Texas Instruments
Texas Instruments: Boat Registration and Manatee Deaths in Florida
Students will explore the data on boat registrations and manatee deaths in Florida. They will use the data, the graph of the data and the line of best fit to make predictions about the relationship of the data.
Illustrative Mathematics
Illustrative Mathematics: S Id.7 Used Subaru Foresters
Jane wants to sell her Subaru Forester and does research online to find other cars for sale in her area. She examines the scatterplot of price versus age and determines that a linear model is appropriate. Answer a variety of questions...
Writing Fix
Writing Fix: Rolling With the Animals
After reading Duck on a Bike by David Shannon, the writer will plan an original story where an animal (other than a duck) finds itself in a human mode of transportation (other than a bike). Three other animals will react to the unusual...
Texas Instruments
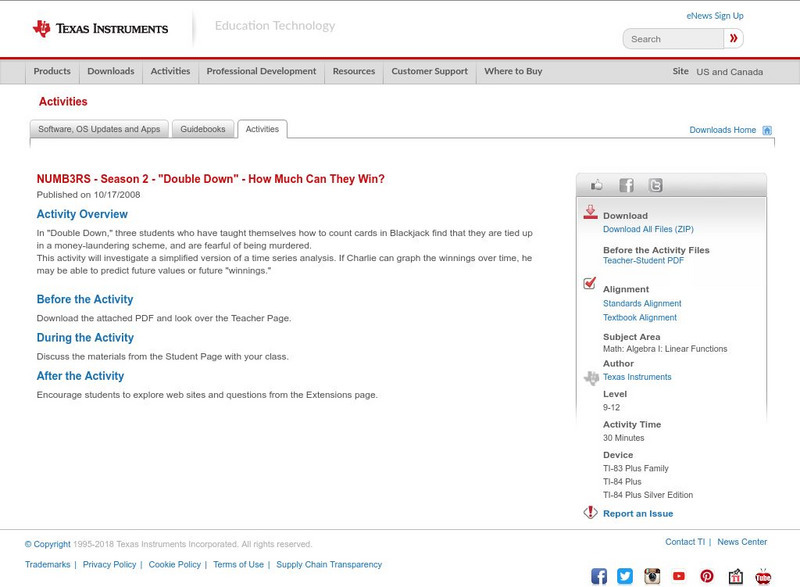
Texas Instruments: Numb3 Rs: How Much Can They Win?
Based off of the hit television show NUMB3RS, this lesson has students create data points from given information, plot those points, and then create a line of best fit. This is done in the context of playing blackjack, although the...
University of Illinois
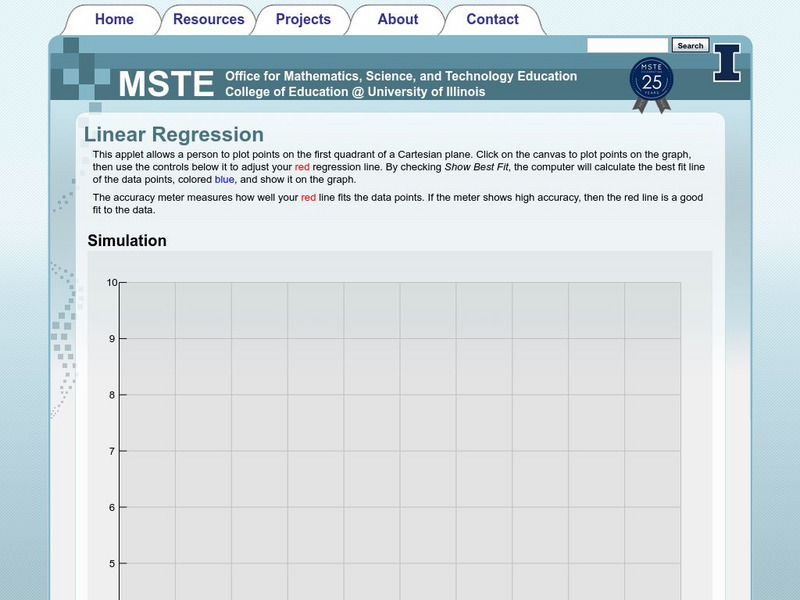
University of Illinois: Linear Regression Applet
This applet allows you to plot up to fifty points and it will display a best fit line and give you the slope of that line.
Texas Instruments
Texas Instruments: Numb3 Rs: Dialing Ben
Based off of the hit television show NUMB3RS, this lesson has students try to discover if there has been a significant change in cell phone use over the course of ten days. If so, this "change point" can be detected by creating a line of...
Texas Instruments
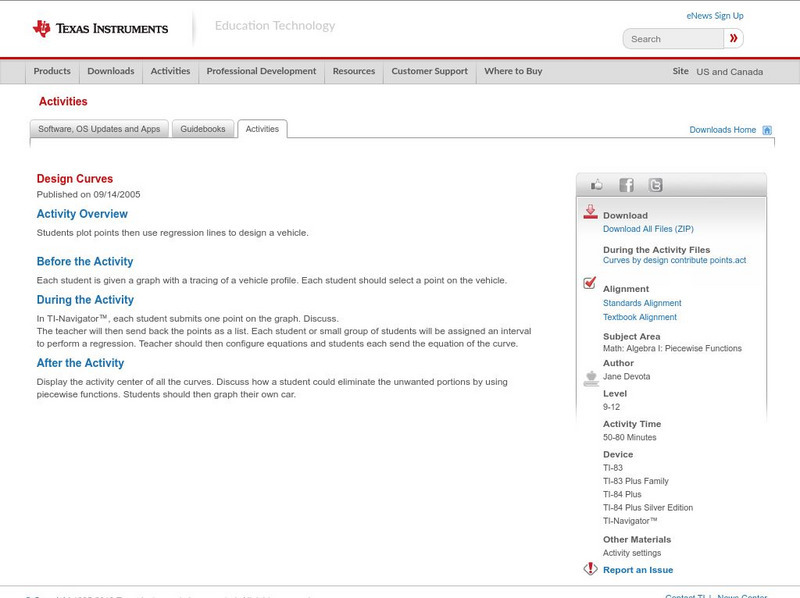
Texas Instruments: Design Curves
Students plot points then use regression lines to design a vehicle.
Shodor Education Foundation
Shodor Interactivate: Linear Regression and Correlation
Students are introduced to correlation between two variables and the line of best fit.
Discovery Education
Discovery Education: Web Math: Plots and Geometry
This site provides descriptions and helpful hints regarding conic sections - circles, parabolas, ellipses, and hyperbolas. Content also includes interactive problem solvers complete with a full analysis of the math behind the answer.
PBS
Pbs Teachers: Galileo's Battle for the Heavens Plotting Sun Spots
In this activity, students follow in Galileo's footsteps as they examine the nature of sunspot cycles, define solar minimum and solar maximum, and graph data for a solar cycle. Then they will predict the next solar maximum and when the...
Duke University
Duke University: Web Feats Ii: Lessons on Regression at Hessian
This site has several lessons on regression, "Designed to help students visualize topics associated with lines of regression, given a set of data points." Go to the teacher notes to find the objectives and standards which apply.
Other
Ithaca Hs Ny/electrical Generator Ac or Dc/applet
What a lovely little applet! You can speed/slow it, change it from AC to DC, plot the voltage as it rotates, change direction, control other information. Real neat.
Cuemath
Cuemath: Linear Graph
A comprehensive guide for learning all about linear graphs with definitions, properties, their equations, how to plot or analyze them, solved examples, and practice questions.
National Council of Teachers of Mathematics
The Math Forum: Chameleon Graphing: Coordinate Plane
Dive into this introduction to graphing in the coordinate plane, and meet a chameleon named Sam. Sam will help guide you through graphing points on a line, using negative numbers, and graphing points in the coordinate plane.
Washington State University
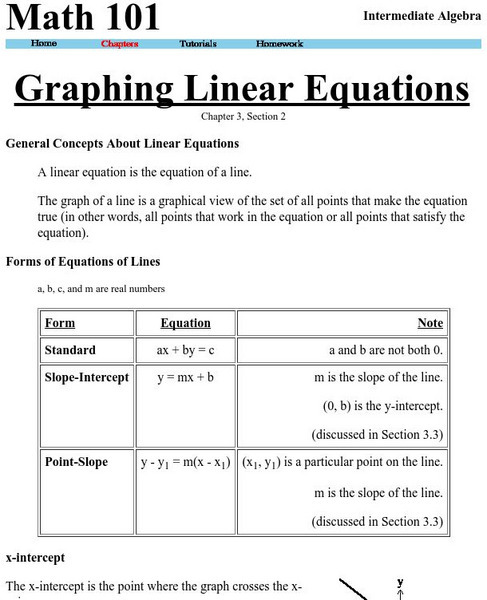
Washington State University: Graphing Linear Equations
This site explains what a linear equation is, general forms of linear equations, how to graph a line using the method of plotting points. The site also details how to find points on the line given the equation, information about the...
ClassFlow
Class Flow: Linear Models
[Free Registration/Login Required] This flipchart explores both linear models and scatter plots.
Wyzant
Wyzant: Graphing Lines by Graphing Two Points
The resource has students practice graphing the line of a given equation. The worksheet consists of an example, answer sheet, and printable graph paper.
TeachEngineering
Teach Engineering: Graphing the Rainbow
Students are introduced to different ways of displaying visual spectra, including colored "barcode" spectra, like those produced by a diffraction grating, and line plots displaying intensity versus color, or wavelength. Students learn...
Other
Online Statistics Education: Graphing Distributions [Pdf]
This is the second chapter of a statistics e-text developed collaboratively by Rice University, University of Houston Clear Lake, and Tufts University. It looks at many different types of data displays and the advantages and...
Oswego City School District
Regents Exam Prep Center: Regression Analysis
A collection of lesson ideas, a practice activity, and teacher resources for exploring regression analysis.
Other popular searches
- Line Plot Worksheets
- Frequency Tables Line Plots
- Line Plot Graphs
- 1st Grade Line Plot
- Free Line Plot
- Line Plot Pictures
- Frequency Table Line Plot
- Plot Line
- Line Plots Grade 3
- Scatter Plot Trend Line
- Line Plot Outliers
- Fraction Line Plot


