Hi, what do you want to do?
Curated OER
Conductivity of salt Solutions
Students investigate the concentration level of solutions. In this math/science lesson, students identify three different ionic compounds. They predict the conductivity of each using their collected data.
Curated OER
Centripetal Force
Students experiment to show the components that dictate centripetal force in an object. They observe how the object moves in a circular path around a central point.
Curated OER
Winchester Transit Problem
In this transit problem worksheet, students read clues about bus stops and their routes. They determine the time between stops and the shortest path possible. This one-page worksheet contains 1 multi-step problem. The...
Curated OER
Optimization For Breakfast
Students identify he proportion of a cereal box. In this algebra lesson, students define the relationship between patterns, functions and relations. They model their understanding using the cereal box.
Curated OER
Sunken Slave Ship
Students imagine they are archaeologists who are looking for treasure under the sand or sea. They work in teams to create the story and site of a shipwreck in a tub or aquarium filled with sand and water.
Curated OER
A Statistical Look at Jewish History
Young scholars complete their examination over the Jewish Diaspora. Using population figures, they discover the importance of percentages in exploring trends. They use their own ethnic group and determine how it is represented in the...
Curated OER
The Environment and Interactions of Living Organisms
Students study the environment and interactions of living organisms. They identify abiotic and biotic factors and create a foldable and vocabulary cards. They create a poster illustrating soil and watch a video to study symbiosis.
Curated OER
Lesson Design Archaeology
Students participate in their own excavation and measure and record as they go. For this archaeology lesson students divide into groups and solve the mystery of what they uncovered in their dig box.
Curated OER
Could You Repeat That?
Students participate in an oral story telling activity designed to show how story embellishments occur. They read "Beowulf" and identify incongruities that suggest additions and embellishments over the years.
Curated OER
Risky Business
Students view a video on AIDS, HIV and the ways in which HIV is spread. They discuss ways to avoid contracting HIV and participate in a simulation that shows the growth of a communicable disease.
Curated OER
A Functional Housing Market
Students access the Internet to search for housing prices in Houston, Texas,(the location can be changed to accommodate any location) and compare the prices to the number of square feet found in the living area of a house.
Curated OER
Sunrise and Sunset
Pupils utilize a Mesonet daily solar radiation to determine the times of sunrise and sunset and the length of the day. They describe how sunrise and sunset change with latitude and longitude and how the length of the day changes with...
Curated OER
What Percentage of your Class is Right or Lef Handed?
Students using their right hands, put the first letter of their last name in each square on a piece of square grid paper. Then after the 20 seconds is up, they do the same thing using their left hands.
Curated OER
Go the Distance
Students work together to build lego cars. They make predictions about how fast they believe the cars will go. They record their observations and discuss their results.
Curated OER
THE AREA OF A CIRCLE
Learners examine the relationship between circumference and diameter and how to use the formula to find the area of a circle. In this circle lesson students divide into groups and complete an activity.
Math Planet
Math Planet: Algebra 2: Line Plots and Stem and Leaf Plots
Provides examples and a video lesson that illustrate line plots and stem-and-leaf plots. [1:12]
Other
Northern Michigan University: Line Plots
The author utilizes a line plot to demonstrate what an "outlier" is, what "clusters" are, and what "gaps" are.
Texas Instruments
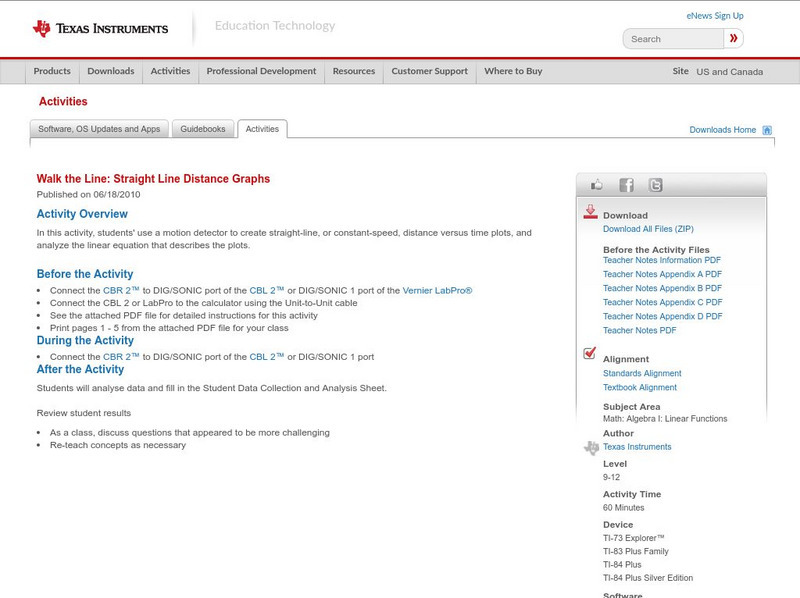
Texas Instruments: Walk the Line: Straight Line Distance Graphs
In this activity, students' use a motion detector to create straight-line, or constant-speed, distance versus time plots, and analyze the linear equation that describes the plots.
Cuemath
Cuemath: Line Graphs
A comprehensive guide for learning all about line graphs with definitions, their sections, how to read and create graphs, solved examples, and practice questions.
University of Regina (Canada)
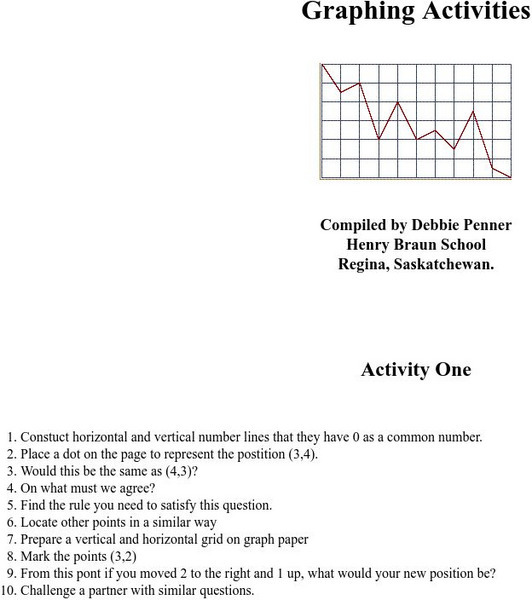
University of Regina: Math Central: Graphing Activities
Eighteen different graphing activities will teach students how to plot points, draw lines, compare graphs, and problem solve.
University of Regina (Canada)
University of Regina: Math Central: Graphing Activities
Eighteen different graphing activities will teach students how to plot points, draw lines, compare graphs, and problem solve.
Mangahigh
Mangahigh: Algebra: Draw Straight Line Graphs
Mangahigh is a website with math games aimed at twelve to eighteen year olds. On this site students plot graphs of explicit linear functions.
BBC
Bb Ci: Exponential Graphs (Higher)
Exponential graphs increase rapidly in the Y direction and will never fall below the X -axis, thus forming a curve.
Oswego City School District
Regents Exam Prep Center: Scatter Plots and Line of Best Fit
Use this lesson, practice exercise, and teacher resource in planning instruction on scatter plots and line of best fit. In the lessons, you'll find definitions and examples of ways to make a scatter plot, determine correlations, and find...


