Hi, what do you want to do?
Other
Online Statistics Education: Graphing Distributions [Pdf]
This is the second chapter of a statistics e-text developed collaboratively by Rice University, University of Houston Clear Lake, and Tufts University. It looks at many different types of data displays and the advantages and...
National Council of Teachers of Mathematics
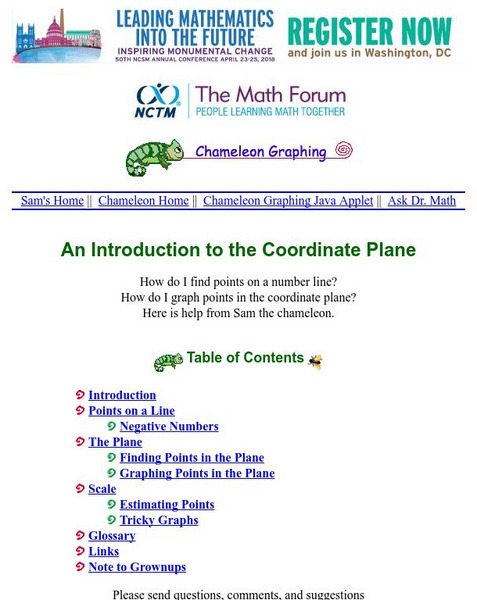
The Math Forum: Chameleon Graphing: Coordinate Plane
Dive into this introduction to graphing in the coordinate plane, and meet a chameleon named Sam. Sam will help guide you through graphing points on a line, using negative numbers, and graphing points in the coordinate plane.
Mangahigh
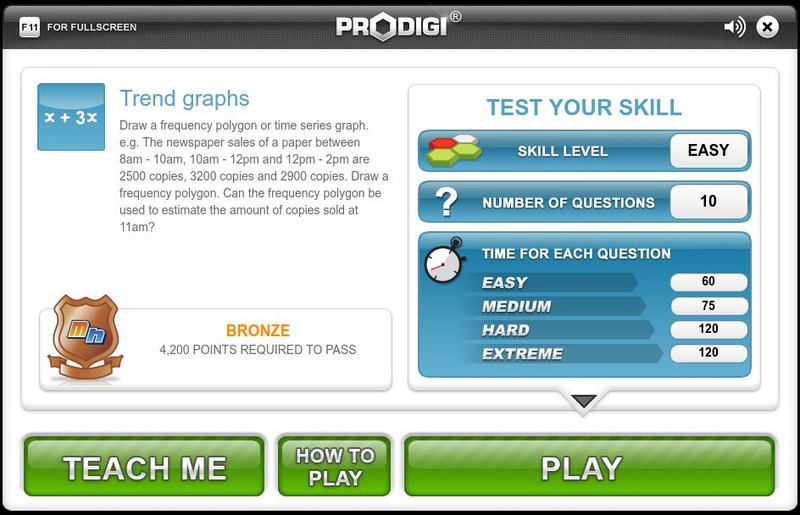
Mangahigh: Data: Trend Graphs
Students explore the concept of frequency trend graphs by working through an online tutorial and then attempting a ten question quiz that increases in difficulty as questions are answered correctly.
Cuemath
Cuemath: Linear Graph
A comprehensive guide for learning all about linear graphs with definitions, properties, their equations, how to plot or analyze them, solved examples, and practice questions.
CK-12 Foundation
Ck 12: Algebra: Fitting Lines to Data
[Free Registration/Login may be required to access all resource tools.] Make a scatter plot of data and find the line of best fit to represent that data.
CK-12 Foundation
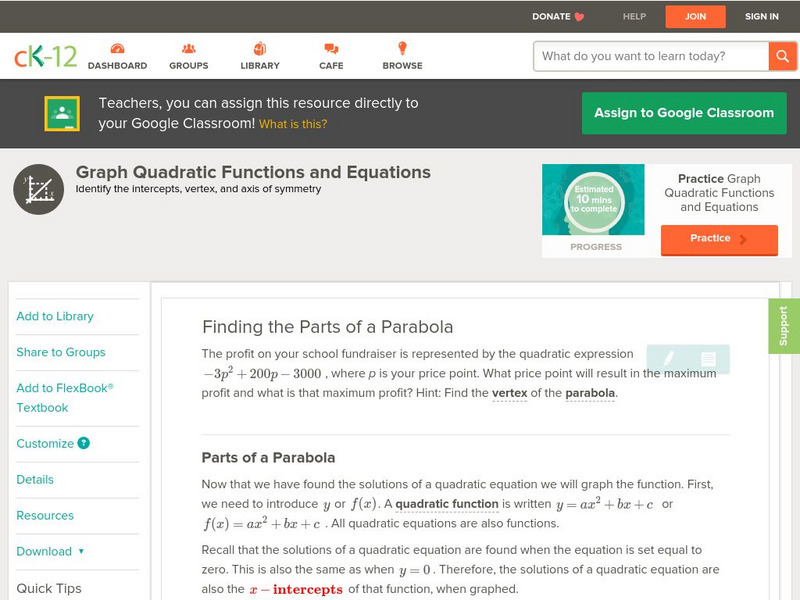
Ck 12: Algebra: Quadratic Functions and Their Graphs
[Free Registration/Login may be required to access all resource tools.] Learn the anatomy of the graph of a quadratic function.
National Council of Teachers of Mathematics
Nctm: Illuminations: Line of Best Fit
Use this activity to practice how to enter a set of data, plot the data on a coordinate grid, and determine the equation for a line of best fit.
University of Illinois
University of Illinois: Line Graphs
Line graphs are shown and explained here. You can learn what kind of data is best represented using a line graph. There are also line graphs with questions and answers available to help you learn how to read them.
University of Waterloo (Canada)
Univ. Of Waterloo: Wired Math: Linear Graphing: Graphing and Analyzing [Pdf]
The mathematics resource assesses students on linear relations. The activity has problems with graphing and analyzing linear relations. Some of the topics included are variation, scatter plots and linear relationships. The worksheet has...
University of Regina (Canada)
University of Regina: Math Central: Linear Graphs
Students gain the knowledge of how to plot and recognize first degree equations on a graph. The lesson has an overview, materials, procedures, and evaluation techniques.
PBS
Pbs Teachers: Galileo's Battle for the Heavens Plotting Sun Spots
In this activity, students follow in Galileo's footsteps as they examine the nature of sunspot cycles, define solar minimum and solar maximum, and graph data for a solar cycle. Then they will predict the next solar maximum and when the...
Texas A&M University
Wtamu Virtual Math Lab: Intermediate Algebra
This site is a tutorial for students in algebra 2 or for those who need a refresher. The site has explanations, definitions, examples, practice problems and practice tests are found covering topics such as linear equations, graphing,...
TeachEngineering
Teach Engineering: Graphing the Rainbow
Students are introduced to different ways of displaying visual spectra, including colored "barcode" spectra, like those produced by a diffraction grating, and line plots displaying intensity versus color, or wavelength. Students learn...
Shmoop University
Shmoop: Basic Algebra: Graphing Lines by Plotting Points
The tutorial discusses how to graph lines by plotting points. Learners explore the concept through notes and examples. Practice problems are included to check for comprehension of the algebra topic.
Varsity Tutors
Varsity Tutors: Hotmath: Practice Problems: Tables and Graphs
Six problems present various aspects of using and making tables and graphs to display statistics. They are given with each step to the solution cleverly revealed one at a time. You can work each step of the problem then click the "View...
University of Regina (Canada)
University of Regina: Math Central: Basics of Graphing
Students learn the basics of graphing including terminology, plotting, and reading points. The instructional activity has an overview, materials, procedures, and evaluation techniques.
University of Regina (Canada)
University of Regina: Math Central: Basics of Graphing
Students learn the basics of graphing including terminology, plotting, and reading points. The lesson has an overview, materials, procedures, and evaluation techniques.
Discovery Education
Discovery Education: Web Math: Graph a Line
WebMath offers a java applet that allows you to input the slope of a line and a point on the line and gives you the equation, in slope-intercept form, of the line with the given slope that passes through the point. It also includes a...
Science Education Resource Center at Carleton College
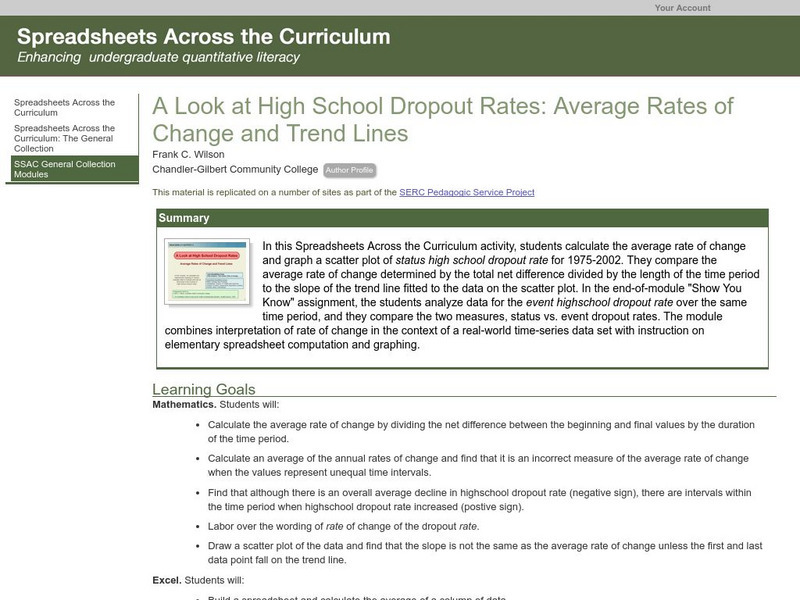
Serc: Average Rates of Change and Trend Lines
In this Spreadsheets Across the Curriculum activity, students calculate the average rate of change and graph a scatter plot of status high school dropout rate for 1975-2002. The module combines interpretation of rate of change in the...
National Council of Teachers of Mathematics
The Math Forum: Ask Dr. Math: Graphing Parabolas
Dr. Math helps a student with the plotting and with finding the vertex and line of symmetry of a parabola.
Washington State University
Washington State University: Graphing Linear Equations
This site explains what a linear equation is, general forms of linear equations, how to graph a line using the method of plotting points. The site also details how to find points on the line given the equation, information about the...
Math Graphs
Houghton Mifflin: Math Graphs: Line of Best Fit 1 [Pdf]
The practice problem examines the line of best fit and scatter plots. The scatter plot is available in PDF format.
Math Graphs
Houghton Mifflin: Math Graphs: Line of Best Fit 2 [Pdf]
The practice problem examines the line of best fit and scatter plots. The scatter plot is available in PDF format.
Math Graphs
Houghton Mifflin: Math Graphs: Line of Best Fit 3 [Pdf]
Students sketch the line that best approximates the data in a scatter plot. The scatter plot is available in PDF format.


![Online Statistics Education: Graphing Distributions [Pdf] eBook Online Statistics Education: Graphing Distributions [Pdf] eBook](https://static.lp.lexp.cloud/images/attachment_defaults/resource/large/FPO-knovation.png)
