Hi, what do you want to do?
Other
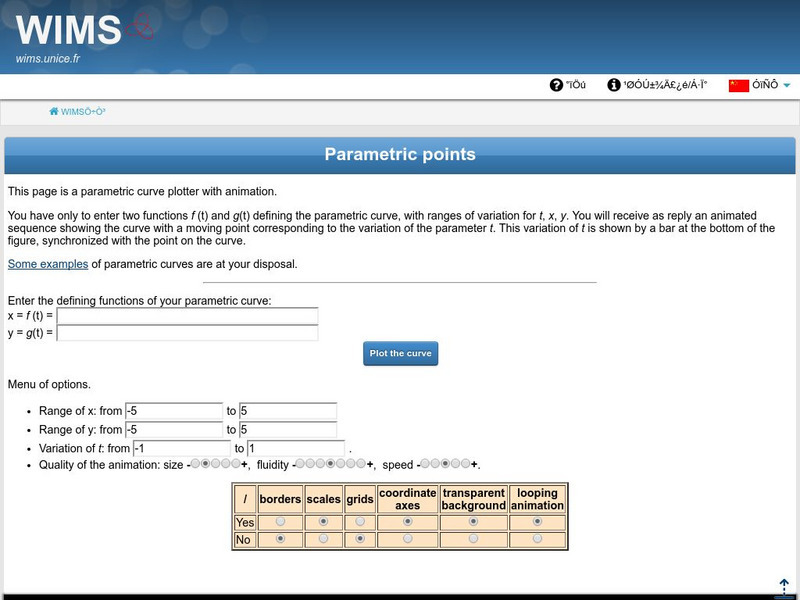
Universite Nice: Parametric Points
This site allows the student to input the curves and the curve will be plotted.
Mangahigh
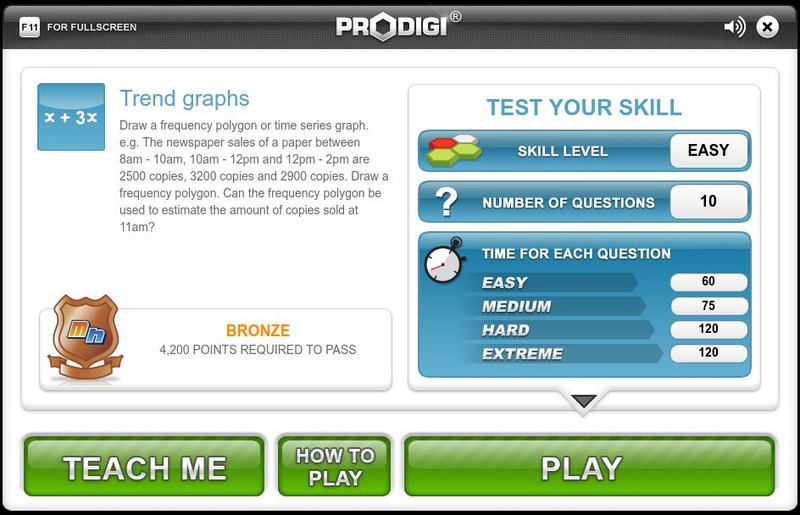
Mangahigh: Data: Trend Graphs
Students explore the concept of frequency trend graphs by working through an online tutorial and then attempting a ten question quiz that increases in difficulty as questions are answered correctly.
Varsity Tutors
Varsity Tutors: Hotmath: Practice Problems: Tables and Graphs
Six problems present various aspects of using and making tables and graphs to display statistics. They are given with each step to the solution cleverly revealed one at a time. You can work each step of the problem then click the "View...
Khan Academy
Khan Academy: Linear Regression Review
Linear regression is a process of drawing a line through data in a scatter plot. The line summarizes the data, which is useful when making predictions.
Rice University
Rice University: The Hand Squeeze
Students will enjoy this data collection and class analysis experiment involving the time it takes for a hand squeeze to travel around a circle of people. From organizing the activity to collecting the data to making a table and graphing...
Library of Congress
Loc: How to Find a Novel,etc. Without Knowing Its Title or Author
Use this guide to help identify a literary work when they know only its plot or subject, or other textual information such as a character's name, a line of poetry, or a unique word or phrase. Trusted databases, library catalogs, and more...
University of Colorado
University of Colorado: Ph Et Interactive Simulations: Charges and Fields
Arrange positive and negative charges in space and view the resulting electric field and electrostatic potential. Plot equipotential lines and discover their relationship to the electric field. Create models of dipoles, capacitors, and...
TeachEngineering
Teach Engineering: Can You Resist This?
This lab demonstrates Ohm's law as students set up simple circuits each composed of a battery, lamp and resistor. Students calculate the current flowing through the circuits they create by solving linear equations. After solving for the...
Missouri State University
Missouri State University: Introductory Statistics: Linear Regression Models
Four examples which use the linear regression model in real-world applications. The site continues with discussion on how to correctly construct the regression model, how its results can be analyzed, and what can come from it.
Science Education Resource Center at Carleton College
Serc: Investigating Gravity: Predicting Time to Hit the Ground
Students will drop and shoot horizontally "Nerf" balls from a variety of known heights then record the amount of time it takes for the ball to hit the ground for each trial. They will plot height vs. time data and create a trend line for...
Texas Instruments
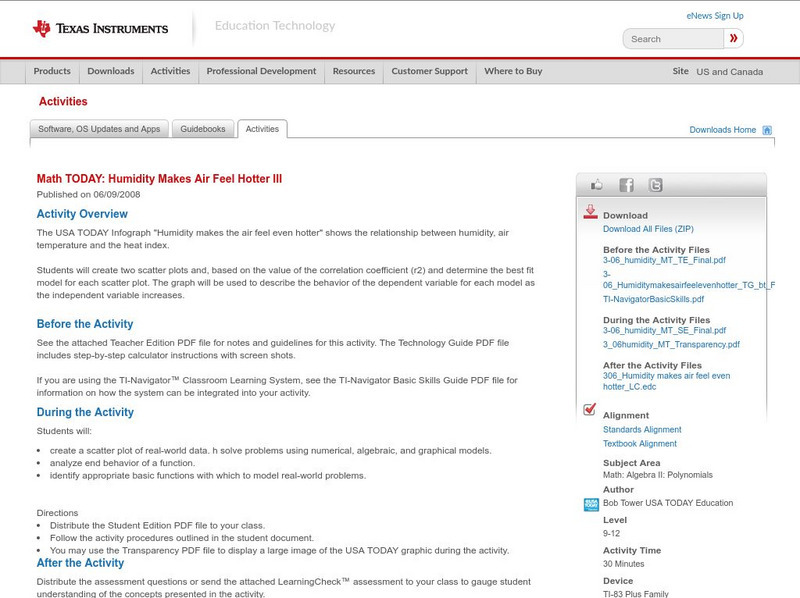
Texas Instruments: Math Today: Humidity Makes Air Feel Hotter Iii
Investigate the relationship among humidity, air temperature, and the heat index while learning about modeling data, evaluating functions, and describing the end behavior of a function. Students will use graphing calculator technology to...
Texas Instruments
Texas Instruments: What Is a Linear Regression?
In this activity, students create lists of data points, plot them on a graph, and determine the regression equation of the best fitting line. They also understand exactly how the linear regression is determined.
Texas Instruments
Texas Instruments: Defining the Parabola
The teacher will graph a horizontal line and plot a point using TI-Navigator, and the class will provide the points that create a parabola.
State University of New York
State University of New York: The Classius Clapyron Equation
The Classius-Clapyron equation can be used to determine the enthalpy of vaporization from vapor pressure measurements over a range of temperatures. In this simulation students are asked to create the appropriate plot of the data and use...
Other
Algebra.com: Linear Equation and System Solvers: Solve Linear Systems
This interactive linear system solver allows you to enter two linear equations in general form and then plot the lines and find the answer using either substitution or elimination. The answer is presented with both methods accompanied by...
CK-12 Foundation
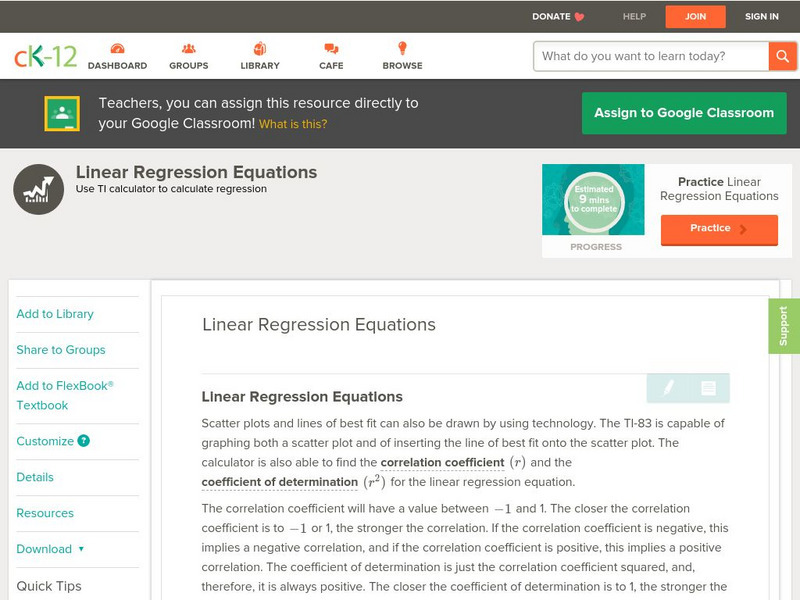
Ck 12: Statistics: Linear Regression Equations
[Free Registration/Login may be required to access all resource tools.] Use a calculator to create a scatter plot and to determine the equation of the line of best fit.
McGraw Hill
Glencoe Mathematics: Online Study Tools: Histograms
This site gives a short interactive quiz which allows students to self-assess their understanding of the concept of histograms.
Georgia State University
Georgia State University: Hyper Physics: Ionization Energies
A concise description of ionization energy, and a line graph that plots the ionization energies of the first 88 elements vs. the atomic numbers.
Other
Young Adults Books: Pigs in Heaven
Contains a book review for Pigs in Heaven, which contains mainly a plot summary and a few lines of commentary by the writer. No additional information is given.
Sophia Learning
Sophia: Two Step Linear Inequalities: Lesson 2
This lesson will go over how to solve a two-step linear inequality and plot the solution on the number line.
Richland Community College
Richland Community College: Math 116 Lecture Notes
This site from the Richland Community College provides the detailed lecture notes to a college algebra course, complete with equations and definitions. Content ranges from "functions and their graphs" to "conics and parametric equations."
Curated OER
Georgia State University Hyperphysics: Ionization Energies
A concise description of ionization energy, and a line graph that plots the ionization energies of the first 88 elements vs. the atomic numbers.
Other popular searches
- Frequency Tables Line Plots
- Line Plots Grade 3
- Math Line Plots
- Christmas Line Plots
- Line Plots and Tallies
- Activities Using Line Plots
- Data Analysis Line Plots
- Human Line Plots
- Ell Math Line Plots
- Line Plots With Airplanes
- Charts, Tables, Line Plots
- Charts Tables Line Plots


