Curated OER
Moving On Up!
Students complete a game-like simulation to determine a career and salary. In groups, they collect information and decide what is the "best" city in which to live. They create a monthly budget for their "best" city based on salary from...
Curated OER
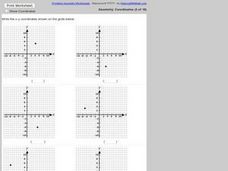
Identifying Points in the Coordinate Plane
For this ordered pairs worksheet, students identify 6 ordered pairs given a coordinate plane. Students list the ordered pair given the graph.
Curated OER
A Functional Housing Market
Students access the Internet to search for housing prices in Houston, Texas,(the location can be changed to accommodate any location) and compare the prices to the number of square feet found in the living area of a house.
Curated OER
Graphs and Ellipses
Students explore linear graphs, the parabola and the rectangular hyperbola.
Curated OER
Go the Distance
Students work together to build lego cars. They make predictions about how fast they believe the cars will go. They record their observations and discuss their results.
Curated OER
Fitting Periodic Functions-Distant Planets
In this periodic functions instructional activity, students use given data of the speed of a star and find the best fit periodic function that follows the trend in data. They determine the amplitude, offset phase and the formula for the...
Curated OER
Creating a Commercial
Students investigate the world of advertising and video production by creating their own commercial. In this advertising lesson, students discuss a fictitious product which they create an advertising campaign for. Students...
Curated OER
pH Testing
Students explore the use of variables in the scientific method. They identify the dependent and independent variables through pH testing. Students construct graphs of their data and analyze their findings.
Curated OER
Travel Mug Design
Students create and develop a travel mug. They create visuals and a three dimensional infomercial. They apply an engineering design and demonstrate knowledge of thermodynamics involved in heat transfer. They illustrate Newton's Law of...
Alabama Learning Exchange
The Composition of Seawater
High schoolers explore the concept of finding the composition of seawater. In this finding the composition of seawater instructional activity, students make a saturated salt water solution. High schoolers discuss why there is...
McGraw Hill
Glencoe: Self Check Quizzes 2 Line Plots
Use Glencoe's Math Course 2 randomly generated self-checking quiz to test your knowledge of line plots. Each question has a "Hint" link to help. Choose the correct answer for each problem. At the bottom of the page click the "Check It"...
Math Planet
Math Planet: Algebra 2: Line Plots and Stem and Leaf Plots
Provides examples and a video lesson that illustrate line plots and stem-and-leaf plots. [1:12]
Oswego City School District
Regents Exam Prep Center: Scatter Plots and Line of Best Fit
Use this lesson, practice exercise, and teacher resource in planning instruction on scatter plots and line of best fit. In the lessons, you'll find definitions and examples of ways to make a scatter plot, determine correlations, and find...
Math Is Fun
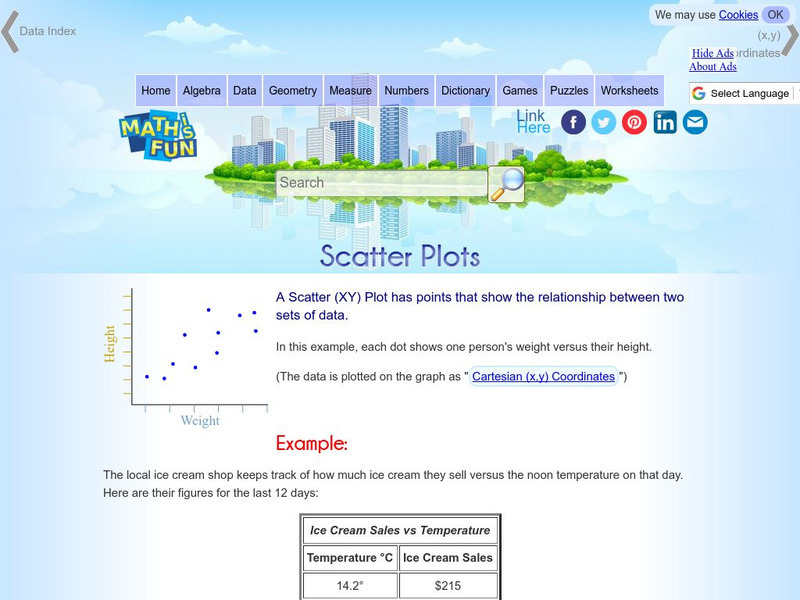
Math Is Fun: Scatter Plots
Explains, with examples, what scatter plots are and how to interpret the data. Discusses trends, interpolation and extrapolation, and correlation. Includes a set of practice questions.
Math Planet
Math Planet: Stem and Leaf Plots and Box and Whiskers Plot
Discover how to use stem-and-leaf plots and box-and-whisker plots to visualize data by taking a look at examples and a video lesson.
Texas A&M University
Wtamu Virtual Math Lab: Intermediate Algebra
This site is a tutorial for students in algebra 2 or for those who need a refresher. The site has explanations, definitions, examples, practice problems and practice tests are found covering topics such as linear equations, graphing,...
National Council of Teachers of Mathematics
The Math Forum: Chameleon Graphing: Coordinate Plane
Dive into this introduction to graphing in the coordinate plane, and meet a chameleon named Sam. Sam will help guide you through graphing points on a line, using negative numbers, and graphing points in the coordinate plane.
Math Drills
Math Drills: Statistics and Probability Worksheets
Download these free worksheets to sharpen your skills with statistics and probability. Sheets focus on collecting and organizing data, measures of central tendency (mean, median, mode, and range), and probability.
Quia
Ixl Learning: Line of Best Fit
Brush up on your math skills relating to the line of best fit then try some practice problems to test your understanding.
University of Waterloo (Canada)
Univ. Of Waterloo: Wired Math: Linear Graphing: Graphing and Analyzing [Pdf]
The mathematics resource assesses students on linear relations. The activity has problems with graphing and analyzing linear relations. Some of the topics included are variation, scatter plots and linear relationships. The worksheet has...
University of Regina (Canada)
University of Regina: Math Central: Quiz Equation of a Line
Quiz on plotting equations, slope and intercepts, equation of a line, and special lines.
University of Regina (Canada)
University of Regina: Math Central: Quiz Equation of a Line
Quiz on plotting equations, slope and intercepts, equation of a line, and special lines.
University of Regina (Canada)
University of Regina: Math Central: Quiz Equation of a Line
Quiz on plotting equations, slope and intercepts, equation of a line, and special lines.
University of Regina (Canada)
University of Regina: Math Central: Basics of Graphing
Students learn the basics of graphing including terminology, plotting, and reading points. The lesson plan has an overview, materials, procedures, and evaluation techniques.

