Hi, what do you want to do?
Khan Academy
Khan Academy: Scatterplots and Correlation Review
A scatterplot is a type of data display that shows the relationship between two numerical variables. Each member of the dataset gets plotted as a point whose x-y coordinates relates to its values for the two variables.
Alabama Learning Exchange
Alex: My Peanut Butter Is Better Than Yours!
The students will engage in the process of statistical data comparing data using tables and scatterplots. The students will compare data using measures of center (mean and median) and measures of spread (range). This lesson can be done...
Khan Academy
Khan Academy: Describing Scatterplots (Form, Direction, Strength, Outliers)
Description and example of a scatter plot.
York University
York Univ.: Statistical Graphics for Multivariate Data
Provides several graphical representations of multivariate data. This paper explains the graphs such as the scatter plot and several other graphs as well. Site is presented in notes and outline format.
Oswego City School District
Regents Exam Prep Center: Categorizing Data
Three lessons on different types of data (qualitative, quantitative, univariate, bivariate, biased data) as well as a practice activity and teacher resource.
Quia
Ixl Learning: Line of Best Fit
Brush up on your math skills relating to the line of best fit then try some practice problems to test your understanding.
Quia
Ixl Learning: Correlation
Brush up on your math skills relating to correlation then try some practice problems to test your understanding.
Richland Community College
Richland Community College: Math 116 Lecture Notes
This site from the Richland Community College provides the detailed lecture notes to a college algebra course, complete with equations and definitions. Content ranges from "functions and their graphs" to "conics and parametric equations."
Oswego City School District
Regents Exam Prep Center: Regression Analysis
A collection of lesson ideas, a practice activity, and teacher resources for exploring regression analysis.
Duke University
Duke University: Web Feats Ii: Lessons on Regression at Hessian
This site has several lessons on regression, "Designed to help students visualize topics associated with lines of regression, given a set of data points." Go to the teacher notes to find the objectives and standards which apply.
Khan Academy
Khan Academy: Linear Regression Review
Linear regression is a process of drawing a line through data in a scatter plot. The line summarizes the data, which is useful when making predictions.
Khan Academy
Khan Academy: Correlation Coefficient Review
The correlation coefficient r measures the direction and strength of a linear relationship. Calculating r is pretty complex, so we usually rely on technology for the computations. We focus on understanding what r says about a scatterplot.
Missouri State University
Missouri State University: Introductory Statistics: Linear Regression Models
Four examples which use the linear regression model in real-world applications. The site continues with discussion on how to correctly construct the regression model, how its results can be analyzed, and what can come from it.
Other
Nearpod: Scatterplots, Correlation & Lines of Best Fit
In this lesson on scatterplots, students will learn how to create the line of best fit and analyze scatterplots by learning about correlations and causation.
That Quiz
That Quiz: Graficas
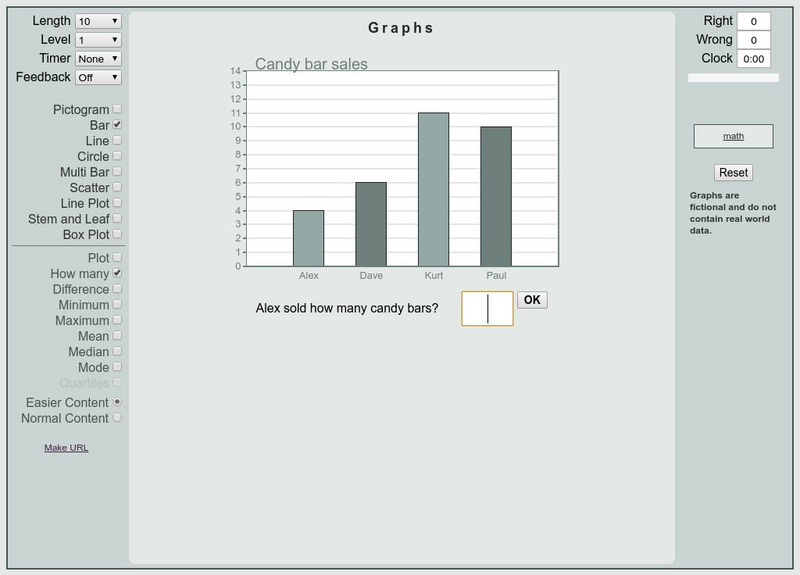
This is an interactive practice to review bar graphs, circle graph, scatter plot, etc. Test are timed and keep track of right and wrong answers. Different levels of difficulties are provided.
Rice University
Rice University: The Hand Squeeze
Students will enjoy this data collection and class analysis experiment involving the time it takes for a hand squeeze to travel around a circle of people. From organizing the activity to collecting the data to making a table and graphing...


