Hi, what do you want to do?
Other
Coe College: Definition of Scatter Plot
This Coe College site contains the definition of scatter plot. Glossary and looking at data section included.
Sophia Learning
Sophia: Scatter Plots: Lesson 4
This lesson introduces scatter plots. It is 4 of 9 in the series titled "Scatter Plots."
Shmoop University
Shmoop: Basic Statistics & Probability: Scatter Plots & Correlation
The statistics resource explores scatter plots and correlation. Students learn about the concepts through notes and detailed examples. The resource consists of practice exercises to check for comprehension of the topics.
Shodor Education Foundation
Shodor Interactivate: Simple Plot
A java applet that helps a student to create a scatter plot using the coordinates and axes and given data.
Math Graphs
Houghton Mifflin: Math Graphs: Fitting Models to Scatter Plots 5 [Pdf]
Students evaluate a scatter plot to determine the relationship between two variables. The scatter plot is available in PDF format.
Math Graphs
Houghton Mifflin: Math Graphs: Fitting Models to Scatter Plots 6 [Pdf]
Learners evaluate a scatter plot to determine the relationship between two variables. The scatter plot is available in PDF format.
ClassFlow
Class Flow: The Golden Ratio Scattered Plots
[Free Registration/Login Required] This lesson is a discovery lesson where the students have to create a scattered plot and find a linear correlation that approximates the golden ratio.
National Council of Teachers of Mathematics
The Math Forum: Nctm: Ask Dr. Math: Graphing Scatter Plots
This page is in response to a question that someone emailed Dr. Math. It shows how to make a scatter plot for peoples' height and shoe sizes. The information is somewhat brief, but worth checking out on the subject.
National Council of Teachers of Mathematics
The Math Forum: Nctm: Ask Dr. Math: Correlation of a Scatterplot
This page from Ask Dr. Math describes the correlation of a scatterplot and gives an example of one with no correlation.
Math Graphs
Houghton Mifflin: Math Graphs: Fitting Models to Scatter Plots 1 [Pdf]
Students use a scatter plot to determine whether data can be modeled by a linear function, a quadratic function, a trigonometric function, or that there appears to be no relationship between x and y. The resource consists of an enlarged...
Math Graphs
Houghton Mifflin: Math Graphs: Fitting Models to Scatter Plots 2 [Pdf]
Students use a scatter plot to determine whether data can be modeled by a linear function, a quadratic function, a trigonometric function, or that there appears to be no relationship between x and y. The resource consists of an enlarged...
Math Graphs
Houghton Mifflin: Math Graphs: Fitting Models to Scatter Plots 3 [Pdf]
Students use a scatter plot to determine whether data can be modeled by a linear function, a quadratic function, a trigonometric function, or that there appears to be no relationship between x and y. The resource consists of an enlarged...
Math Graphs
Houghton Mifflin: Math Graphs: Fitting Models to Scatter Plots 4 [Pdf]
Students use a scatter plot to determine whether data can be modeled by a linear function, a quadratic function, a trigonometric function, or that there appears to be no relationship between x and y. The resource consists of an enlarged...
Math Graphs
Houghton Mifflin: Math Graphs: Fitting Models to Scatter Plots 7 [Pdf]
Learners use a given scatter plot to identify whether the data can be modeled by a linear, quadratic, or trigonometric function. The math graph is available in PDF format.
Math Graphs
Houghton Mifflin: Math Graphs: Fitting Models to Scatter Plots 8 [Pdf]
Learners use a scatter plot to identify whether the data can be modeled by a linear, quadratic, or trigonometric function. The math graph is available in PDF format.
University of South Florida
Florida Center for Instructional Tech: Famous People
Students estimate the ages of famous people, then create a scatterplot with the actual ages. This activity allows them to estimate with linear equations. You can access the age data through the "activity" link.
Annenberg Foundation
Annenberg Learner: Against All Odds: Describing Relationships
Video program showing how to use a scatter plot to illustrate relationship between response and explanatory variables, to determine patterns in variables, and to calculate least squares. Real-life examples -- manatee deaths per number of...
Texas Instruments
Texas Instruments: Math Today for Ti: Is Leisure Time Really Shrinking
Students will to organize data from the USA TODAY Snapshot, "Is leisure time really shrinking?," into two scatter plots and determine the quadratic model for each scatter plot. Students will determine if these graphs intersect and learn...
Texas Instruments
Texas Instruments: Scatterplots and Correlation With Ti 89
Students input data relating the values of one variable associated with values of another and use these data to generate a scatterplot. From the scatterplot, they determine whether there is a correlation between the two variables and...
CK-12 Foundation
Ck 12: Algebra: Applications of Function Models
[Free Registration/Login may be required to access all resource tools.] In this lesson students draw a scatter plot of data, find and draw the function that best fits that data, and make predictions from that information. Students watch...
Shodor Education Foundation
Shodor Interactivate: Scatter Plot
Graph ordered pairs and customize the graph title and axis labels. Points are connected from left to right, rather than being connected in the order they are entered.
Texas Instruments
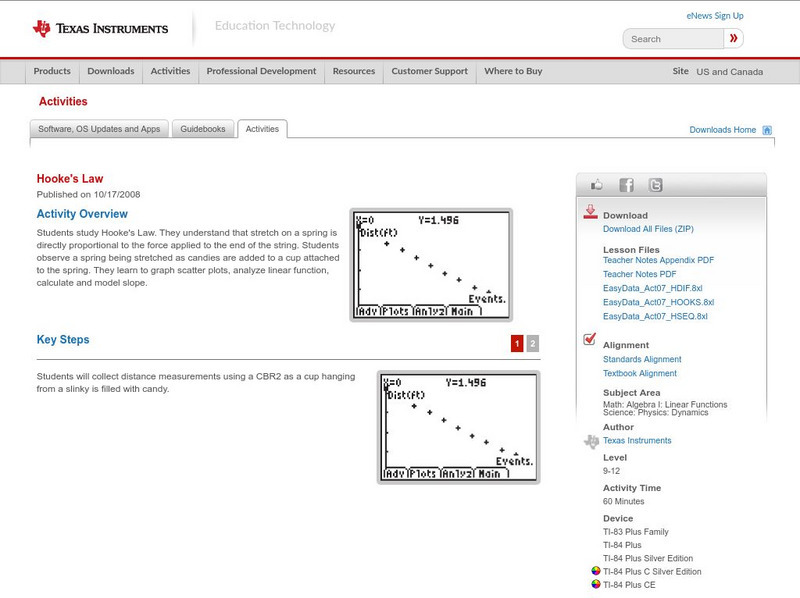
Texas Instruments: Hooke's Law
In this activity, students study Hooke's Law. They understand that stretch on a spring is directly proportional to the force applied to the end of the string. Students observe a spring being stretched as candies are added to a cup...
Texas Instruments
Texas Instruments: Glencoe Algebra 1: Graphing Calculator Investigation Curve
Students will make scatter plots and find the appropriate regression equations that best fit the data.
Texas Instruments
Texas Instruments: Height vs Arm Span
This is a quick class opener. That allow students to practice reading scatter plots and determining the correlation among data points.
Other popular searches
- Math Scatter Plots
- Algebra Scatter Plots
- Creating Scatter Plots
- Candy Scatter Plots
- Data for Scatter Plots
- Pre Algebra/ Scatter Plots
- Interpreting Scatter Plots
- Prue Algebra/ Scatter Plots
- Halloween Scatter Plots
- Scatter Plots and Correlation
- Pr Algebra/ Scatter Plots
- Scatter Plots Ti 83


![Houghton Mifflin: Math Graphs: Fitting Models to Scatter Plots 5 [Pdf] Unknown Type Houghton Mifflin: Math Graphs: Fitting Models to Scatter Plots 5 [Pdf] Unknown Type](https://static.lp.lexp.cloud/images/attachment_defaults/resource/large/FPO-knovation.png)


