Hi, what do you want to do?
CK-12 Foundation
Ck 12: Algebra: Fitting Lines to Data
[Free Registration/Login may be required to access all resource tools.] Make a scatter plot of data and find the line of best fit to represent that data.
Illustrative Mathematics
Illustrative Mathematics: S Id.7 Used Subaru Foresters
Jane wants to sell her Subaru Forester and does research online to find other cars for sale in her area. She examines the scatterplot of price versus age and determines that a linear model is appropriate. Answer a variety of questions...
Illustrative Mathematics
Illustrative Mathematics: S Id.6a,7 Olympic Men's 100 Meter Dash
This task asks students to identify when two quantitative variables show evidence of a linear association and to describe the strength and direction of that association. Students will use a scatterplot showing the finishing times for the...
Alabama Learning Exchange
Alex: My Peanut Butter Is Better Than Yours!
The students will engage in the process of statistical data comparing data using tables and scatterplots. The students will compare data using measures of center (mean and median) and measures of spread (range). This lesson can be done...
Texas Instruments
Texas Instruments: Add Them Up
In this activity, students explore the total voltage provided by several batteries in a series to a battery-operated device. They graph scatter plots, understand multiplication as repeated addition, and use a pattern to develop a...
Texas Instruments
Texas Instruments: Exploring Bivariate Data
Students graph scatter plots and understand the concepts of correlation and least-squares regression. They also perform transformations to achieve linearity in the data plot.
Khan Academy
Khan Academy: Scatterplots and Correlation Review
A scatterplot is a type of data display that shows the relationship between two numerical variables. Each member of the dataset gets plotted as a point whose x-y coordinates relates to its values for the two variables.
Texas Instruments
Texas Instruments: Nevada's Population
In this activity, students examine patterns and use these patterns to try to predict different aspects of an event. They study the statistical patterns for the population of the state of Nevada over a period of hundred years, and predict...
Texas Instruments
Texas Instruments: Math Today for Ti Navigator System: More Students Apply Early
Using the USA TODAY Infograph, "More students apply early," students will explore scatter plots and independent and dependent variables. Students will determine a best-fit regression model for the real-life data set and then use the...
Texas Instruments
Texas Instruments: How High Will It Bounce?
In this activity, students collect the height versus time data of a bouncing ball using the CBR 2. They find the relationship between the bounce number and the bounce height. They learn to graph scatter plots, calculate the maximum value...
Texas Instruments
Texas Instruments: Bouncing Ball
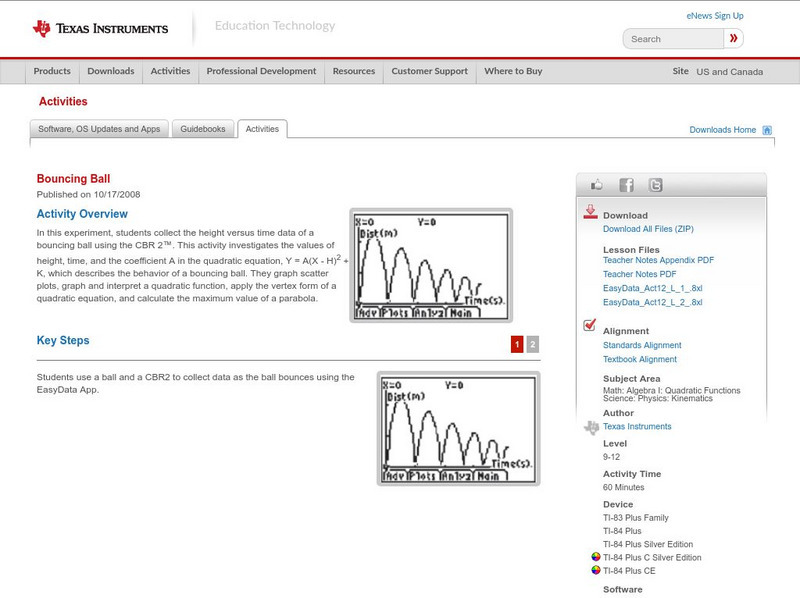
In this experiment, students collect the height versus time data of a bouncing ball using the CBR 2. This activity investigates the values of height, time, and the coefficient A in the quadratic equation, which describes the behavior of...
Texas Instruments
Texas Instruments: Bivariate Data
This set contains statistics questions regarding bivariate data: scatter plots, the least-squares regression line, and their interpretation. The student is asked about the meaning of the various strengths and directions of linear...
University of Waterloo (Canada)
Univ. Of Waterloo: Wired Math: Linear Graphing: Graphing and Analyzing [Pdf]
The mathematics resource assesses students on linear relations. The activity has problems with graphing and analyzing linear relations. Some of the topics included are variation, scatter plots and linear relationships. The worksheet has...
Khan Academy
Khan Academy: Describing Scatterplots (Form, Direction, Strength, Outliers)
Description and example of a scatter plot.
ClassFlow
Class Flow: Scatter Graphs Handling Data
[Free Registration/Login Required] In this flipchart, students analyze a pattern, in the form of a scatter graph then judge the reasonableness of conclusions drawn from a set of data.
Texas Instruments
Texas Instruments: Math Today More Students Apply Early
In this activity students will explore scatterplots and independent and dependent variables. Students will find the mean value of the number of students applying under the early decision plan.
Math Graphs
Houghton Mifflin: Math Graphs: Line of Best Fit 1 [Pdf]
The practice problem examines the line of best fit and scatter plots. The scatter plot is available in PDF format.
Math Graphs
Houghton Mifflin: Math Graphs: Line of Best Fit 2 [Pdf]
The practice problem examines the line of best fit and scatter plots. The scatter plot is available in PDF format.
Math Graphs
Houghton Mifflin: Math Graphs: Line of Best Fit 3 [Pdf]
Students sketch the line that best approximates the data in a scatter plot. The scatter plot is available in PDF format.
Math Graphs
Houghton Mifflin: Math Graphs: Line of Best Fit 4 [Pdf]
Students sketch the line that best approximates the data in a scatter plot. The scatter plot is available in PDF format.
Math Graphs
Houghton Mifflin: Math Graphs: Line of Best Fit 5 [Pdf]
Learners use a scatter plot to determine the line of best fit. The scatter plot is available in PDF format.
Math Graphs
Houghton Mifflin: Math Graphs: Line of Best Fit 6 [Pdf]
Learners use a scatter plot to determine the line of best fit. The scatter plot is available in PDF format.
Math Graphs
Houghton Mifflin: Math Graphs: Line of Best Fit 7 [Pdf]
The practice problem examines the line of best fit and a scatter plot. The scatter plot is available in PDF format.
Math Graphs
Houghton Mifflin: Math Graphs: Line of Best Fit 8 [Pdf]
The practice problem examines the line of best fit and a scatter plot. The scatter plot is available in PDF format.
Other popular searches
- Math Scatter Plots
- Algebra Scatter Plots
- Creating Scatter Plots
- Candy Scatter Plots
- Data for Scatter Plots
- Pre Algebra/ Scatter Plots
- Interpreting Scatter Plots
- Prue Algebra/ Scatter Plots
- Halloween Scatter Plots
- Scatter Plots and Correlation
- Pr Algebra/ Scatter Plots
- Scatter Plots Ti 83


