Hi, what do you want to do?
Curated OER
Heartbeat Project
Young scholars enter information about their heartbeats into a spreadsheet. They construct data displays and calculate statistics. They describe and justify their conclusions from the data collected.
Curated OER
Which Amusement Park Would You Choose?
Students analyze data related to amusement parks and create a spreadsheet to display the data. They read the data and predict which amusement park they think is safer, create a spreadsheet and graph, and write a proposal based on their...
Curated OER
"Measurement in Motion"
Ninth graders examine the rate of motion and changes in motion using a ramp and a rolling object. They conduct the demonstration, determine the average speed, and describe how a moving object can have zero acceleration and deceleration.
Curated OER
Mathematical Models with Applications: The Sounds of Music
Students use an electronic data-collection device to model the sound produced by a guitar string. They identify the graph of a periodic situation and use the graph to determine the period and frequency of sound waves.
Curated OER
Comparison of Two Different Gender Sports Teams - Part 1 of 3 Measures of Central Tendency
Students gather and analyze data from sports teams. In this measures of central tendency lesson, students gather information from websites about sports team performance. Students analyze and draw conclusions from this data. This lesson...
Curated OER
Statistical Analysis of Data by Gender
Students examine and identify gender bias, stereotyping, and discrimination in school materials, activities, and classroom instruction. They apply descriptive statistics knowledge to real-world data.
Curated OER
Travel Mug Design
Students create and develop a travel mug. They create visuals and a three dimensional infomercial. They apply an engineering design and demonstrate knowledge of thermodynamics involved in heat transfer. They illustrate Newton's Law of...
Curated OER
Statistics Newscast in Math Class
Students study sports teams, gather data about the teams, and create a newscast about their data. For this sports analysis lesson, students research two teams and define their statistical data. Students compare the two teams, make...
Curated OER
ou are the Researcher!
Students conduct a census at school. They collect data, tally it, and create a frequency table. Students display their data in three different types of graphs. They write complete sentences describing the graph.
Curated OER
A Statistical Look at Jewish History
Young scholars complete their examination over the Jewish Diaspora. Using population figures, they discover the importance of percentages in exploring trends. They use their own ethnic group and determine how it is represented in the...
Curated OER
In the Wake of Columbus
Students explore how the population decreased in native cultures.
Curated OER
BEETLES: The Coming Out
Students design an experiment to test the variables involved in the hatching of the Bruchid beetle.
Curated OER
Populations Lab - Exponential Graphing
Ninth graders investigate the application of populations that exists in one's everyday environment, in order to develop an understanding of how mathematics is a key component in the understanding of population dynamics.
McGraw Hill
Glencoe: Self Check Quizzes 1 Stem and Leaf Plots
Use Glencoe's randomly generated self-checking quiz to test your knowledge of Stem-and-Leaf Plots. Each question has a "Hint" link to help. Choose the correct answer for each problem. At the bottom of the page click the "Check It" button...
McGraw Hill
Glencoe: Self Check Quizzes 2 Stem and Leaf Plots
Use Glencoe's Math Course 2 randomly generated self-checking quiz to test your knowledge of Stem-and-Leaf Plots. Each question has a "Hint" link to help. Choose the correct answer for each problem. At the bottom of the page click the...
Cuemath
Cuemath: Stem and Leaf Plot
A comprehensive guide for learning all about stem and leaf plots with definitions, how to construct them, solved examples, and practice questions.
Math Planet
Math Planet: Stem and Leaf Plots and Box and Whiskers Plot
Discover how to use stem-and-leaf plots and box-and-whisker plots to visualize data by taking a look at examples and a video lesson.
CK-12 Foundation
Ck 12: Statistics: Two Sided Stem and Leaf Plots
[Free Registration/Login may be required to access all resource tools.] Covers two-sided stem-and-leaf plots.
Math Planet
Math Planet: Algebra 2: Line Plots and Stem and Leaf Plots
Provides examples and a video lesson that illustrate line plots and stem-and-leaf plots. [1:12]
CK-12 Foundation
Ck 12: Statistics: Stem and Leaf Plots and Histograms
[Free Registration/Login may be required to access all resource tools.] Make and interpret stem-and-leaf plots and histograms for a set of data.
Khan Academy
Khan Academy: Stem and Leaf Plots Review
A stem and leaf plot displays numerical data by splitting each data point into a "leaf" (usually the last digit) and a "stem" (the leading digit or digits).
CK-12 Foundation
Ck 12: Statistics: Stem and Leaf Plots Grades 8 9
[Free Registration/Login may be required to access all resource tools.] Learn how to create stem-and-leaf plots and histograms in order to analyze data.
Varsity Tutors
Varsity Tutors: Hotmath: Algebra Review: Stem and Leaf Plots
Find a quick, concise explanation of stem-and-leaf plots. an example is given and clearly explained.
Houghton Mifflin Harcourt
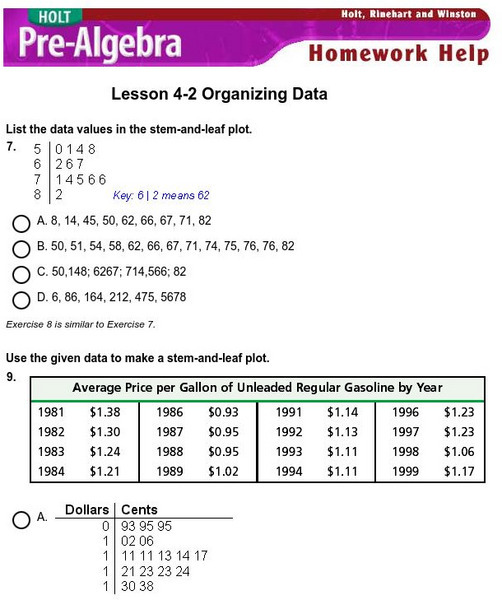
Holt, Rinehart and Winston: Homework Help Independent Practice: Stem and Leaf Plot
Get independent practice organizing data and using stem-and-leaf plots. Each incorrect response gets a text box explanation and another try. Correct responses are confirmed.


