Curated OER
Locate Ordered Pairs
In this ordered pairs instructional activity, students solve and graph 6 different graphs that include various ordered pairs. They determine each ordered pair shown in the graphs. Then, students write the letter for the point named by...
Curated OER
Visualizing Decimals
In this visualizing decimals activity, 7th graders solve 14 different problems that include various forms of decimals. They fill in the missing hundredths parts on each number line. Then, students write the number the picture shows in...
Curated OER
Scatter Graphs
In this scatter graphs instructional activity, students learn a way of illustrating information about two related values. Students complete 30 questions about the graphs. Note: One of the graphs has English pounds. This is intended as an...
Curated OER
Proofs
In this proofs learning exercise, 10th graders solve and graph 8 different equations. First, they prove that each triangle is either congruent or similar. Then, students use the concept of corresponding parts of congruent triangles to...
Curated OER
Triangle Congruence
In this triangle congruence worksheet, 10th graders solve 12 different problems that include determining triangle congruence. First, they prove that triangles are either congruent or similar. Then, students determine whether they can...
Curated OER
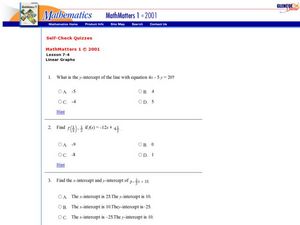
x- and y-Intercepts
In this x- and y-intercepts worksheet, 9th graders solve and graph different problems related to linear equations. First, they determine the x- and y-intercepts by plugging in 0 for each and solving. Then, students find at least one more...
Curated OER
Solving Inequalities
In this solving inequalities worksheet, 9th graders solve 15 different inequalities. First, they use the addition, subtraction, multiplication, and division properties of inequalities to solve linear inequalities. Then, students draw a...
Curated OER
Scatterplots
In this scatterplots worksheet, 9th graders solve 18 different types of problems related to scatterplots. First, they represent a two numerical variable on a scatterplot and describe how the data points are distributed. Then, students...
Curated OER
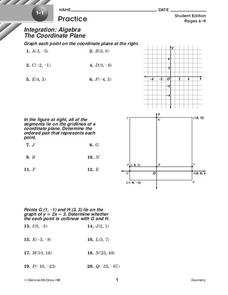
The Coordinate Plane
In this coordinate plane worksheet, 10th graders solve 20 various types of problems all related to identifying point on a coordinate plane. First, they graph each point on the coordinate plane at the top. Then, students determine the...
Curated OER
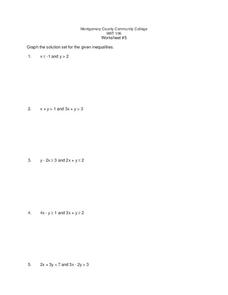
Graphing Linear Inequalities
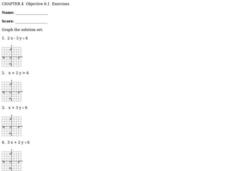
In this graphing linear inequalities worksheet, 9th graders solve 5 different pairs of problems. For each pair of equations, they graph the solution set for each the given inequalities. Then, they determine if any or all of the solution...
Curated OER
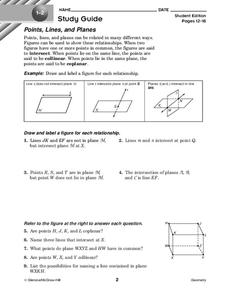
Points, Lines, and Planes
In this points, lines, and planes worksheet, 10th graders solve 9 various problems related to determining points, lines, and planes. First, they define intersect, collinear, and coplanar of one or more points. Then, students draw and...
Curated OER
Two-sided Confidence Interval for a Population Proportion
In this two-sided confidence interval worksheet, students solve 3 problems to include constructing a confidence interval for a population proportion with a large sample. First, they split the confidence and shad its cumulative are for a...
Curated OER
Normal Curve Areas
In this normal curve areas worksheet, learners follow 6 steps to compute probability regarding possible sample means using a large sample. First, they label the scale with the mean and corresponding standard deviations. Then, students...
Curated OER
Normal Curve Areas - Population
In this normal curve areas worksheet, students follow 6 steps to compute the probability regarding the values from the population. First, they label x-scale with the mean and corresponding standard deviations and shade the area(s) under...
Curated OER
Normal Curve Areas
In this normal curve areas worksheet, students follow 6 steps to compute the probability regarding the possible sample of proportions using a large sample population. First, they label the Ps-scale with the proportion and corresponding...
Curated OER
Integers
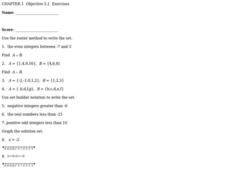
In this integers worksheet, students solve 10 different problems relating to integers. First, they use the roster method to write each set of even integers. Then, students use set builder notation to write the set of negative integers,...
Curated OER
Graphing Inequalities
In this graphing inequalities worksheet, students solve and graph the solution set for eight inequalities. They first solve each inequality, either for x or for y, then they plot the coordinates found on the graph provided for each...
Curated OER
Slope of a Line
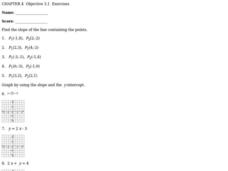
In this slope of a line worksheet, students solve ten problems determining the slope of points and an equation. First, they find the slope of the line containing the two points given in the first five problems. Then, students graph the...
Curated OER
Graphing Linear Equations
For this graphing worksheet, students graph ten linear equations on each of the graphs provided. They first plug in some values to the given equation using a T-chart. This will give them their coordinates to use on the graph and form...
Curated OER
Graphing Ordered Pairs
In this graphing ordered pairs worksheet, 9th graders graph five different sets of numbers on five different graphs. They identify that each of the x-coordinates tells the distance right (positive) or left (negative) and that each...
Curated OER
Freezing and Boiling Point
In this freezing and boiling point graph learning exercise, students use the graph illustrated to respond to several questions that follow. They identify what is the freezing, boiling, and melting point of the substance in the graph....
Curated OER
Chapter 5 - Objective 5.1 Linear Equations
In this linear equations worksheet, students graph linear equations and identify the domain and range of each function. This one-page worksheet contains five problems.
Curated OER
Linear Functions and Piecewise Linear Functions
An activity that could function as a review or as a quiz, this worksheet prompts students to find two different linear functions that satisfy the given equation. Students sketch the graph of two linear equations. They identify the domain...
Curated OER
How The Ear Receives Sound
In this how the ear receives sound learning exercise, students examine and follow a flow chart to view the process of how sound travels within the human ear. Students place the flow chart in chronological order.


