Radford University
Statistical Study
Put your knowledge of sample surveys to good use. Pupils begin by conducting a survey of class members. They identify an appropriate topic and sampling technique; collect and organize their data; compute and analyze statistical measures;...
Radford University
PHamily PHeud: An Exploration in Surveys
Get to know the class much better. Scholars brainstorm a topic of interest and then design and conduct a class survey. Using the top responses, they create a game similar to Family Feud and take part in a class competition.
Radford University
Analyzing Data from Peer Survey
We all want to know what we're thinking. Scholars analyze and report data collected in a previous survey on peer attitudes toward current events. They calculate the mean, median, range, and standard deviation before creating histograms...
Radford University
Peer Survey on Current Events
Stay up to date on current events as well as how the class views the issues. A performance task has scholars select a current event of interest and design a class survey on the topic. They conduct the survey, analyze, and report the...
Radford University
The Next Big Thing
Make sure the next product is a hit. An engaging task has scholars design an item to sell at a sports event and then conduct a marketing survey. They decide whether to use random sampling, stratified sampling, or cluster sampling, and...
Radford University
Survey Activity
It's time to take a survey. After looking at an example of a survey on lunch preferences, groups design their own surveys. They consider the sample size and sampling technique, then conduct the surveys. As a final activity, they create...
Radford University
Data Analysis Activity
What do classmates think? In groups, learners design surveys to investigate chosen topics. They conduct the survey, then analyze the results. As part of the activity, they must calculate the mean, median, mode, variance, and standard...
Radford University
Connecting Theoretical and Experimental Probability
Play some games, develop a law, and then call it a day. Learners first perform a small number of trials for a probability experiment, then predict the result for a larger number of trials. They then compile data from the entire class to...
Radford University
AFDA Probability and Law of Large Numbers
The more trials scholars perform, the closer they'll likely be to the true value. After designing a probability experiment, young mathematicians conduct the experiment for five different numbers of trials. They then analyze the results,...
Radford University
Modeling Statistical Data
Can people predict the number of future divorces? Scholars research and analyze data on the number of divorces and teenage pregnancies in Virginia over time. They use the data to create graphs, determine the best-fit equations, and make...
Radford University
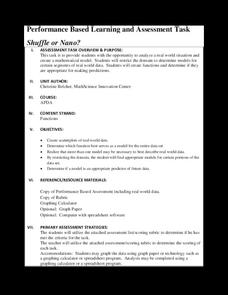
Shuffle or Nano?
Mix up your teaching playlist with a performance-based assessment task. Given iPod sales data for several years, scholars create a scatter plot and perform regression analysis. They determine the best fit curve for different domains.
Radford University
Is Fall Normal?
Fine the normality of fall measurements. Pairs collect measurements of fall leaves and one other fall object. Using the measurements, the groups determine the descriptive statistics for the object and using the Empirical Rule, figure out...
Radford University
Is it Really a Small World After All?
Working in groups, learners research four countries' populations over the past 30 years. Using the data collected, the teams find regression equations that best fit the data. Taking the regression equations, they then make predictions...
Radford University
Pizza, Pizza!
Ponder the problem of pizza prices. Pupils use provided information about two different pricing schedules for pizza. They create tables of values and functions to represent the pricing schemes, consider domain restrictions, and identify...
Radford University
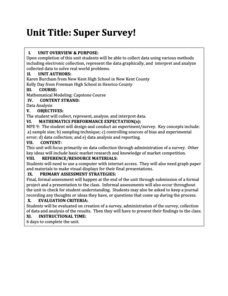
Super Survey!
Here's a super survey on supermarket products. An interactive lesson has classmates design and conduct surveys on a product of interest. They analyze the data, choose a data display method, and present their findings to the class.
Radford University
Real World Data
Make math class feel more real by using real-world data. Scholars research or collect data on several different topics, such as nutrition, the motion of moving objects, cooling curves, and daylight hours. They create scatter plots using...
Radford University
Marketing Mayhem: Advertising for Adolescents
You'll be sold on using the resource. Future consumers first conduct a sample survey on marketing strategies. They then consider how mass media influences their age groups and create presentations to display their findings.
Radford University
How Normal Are You?
It's completely normal to learn about normal distributions. An engaging lesson has young statisticians collect and analyze data about their classmates as well as players on the school's football team. They determine whether each set of...
Radford University
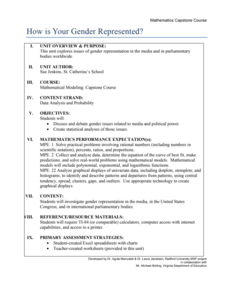
How Is Your Gender Represented?
Does the media shape people's views on gender? Scholars use data on gender portrayal in magazines to explore the idea. They use a spreadsheet program to create bar graphs and perform a chi-square test. They also use provided data to...
Radford University
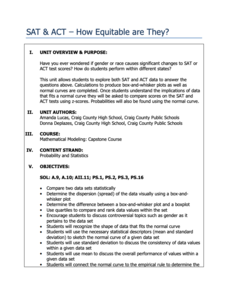
SAT and ACT – How Equitable Are They?
Test the test takers' knowledge of statistics about data from the SAT and ACT tests. Future collegians explore the idea of gender and racial bias in high-stakes college admissions exams. They analyze historical data on average scores by...
Radford University
Let's Buy a Car
Ready to buy a car? Learners research different makes and models of cars to decide on the best one to buy. They collect data on cost, fuel efficiency, safety ratings, and insurance costs, then create and analyze data displays to make...
Radford University
Understanding Local Economic Issues Using Statistics
A good understanding of local economics requires a lot of data. Scholars design and conduct an experimental survey to collect information about economic issues affecting their regions. They analyze their findings and prepare a...
Radford University
Environmental Issues
Pupils investigate the air pollution situation in China by fitting a curve to historical data. They dig deeper into environmental issues that are of interest and provide a mathematical analysis of the issue. Class members develop a route...
Radford University
Feeding the World
Using technology, pupils find an exponential function to model the population growth of the US. With more information, learners derive the population growth formula for the world. Ultimately, they determine the amount of protein needed...


