Curated OER
Worksheet 15: Sequential & Hare Methods
In this Sequential and Hare Method worksheet, students determine the results of elections from given sets of information. They use either the Sequential or Hare Method to determine the outcome. Students justify their answers. This...
Curated OER
Probability and Standard Deviation
In this probability and standard deviation worksheet, high schoolers answer 5 questions derived from one scenario that involving finding percentages.
Curated OER
Scatterplots
In this scatterplots learning exercise, students construct a scatter plot from a given data set. Students then answer 4 questions regarding the least-squares regression line and making predictions.
Curated OER
Stemplots
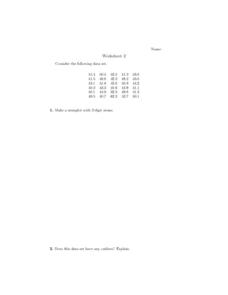
In this stem plot learning exercise, students construct 3 stem plots. Students answer 1 question about outliers and another question regarding which stem plot is preferred.
Curated OER
Penny Toss - Exponential Growth and Decay
In this penny toss worksheet, students collect statistical data by tossing pennies and then create a scatter plot of the data. They use formulas for exponential growth and decay and then plot the function. This two-page document...
Curated OER
Fruit Loops/Cheerios Activity: Measures of Central Tendency
In this measures of central tendency worksheet, students use Fruit Loops and Cheerios to gather statistical data. They find the mean, mode and median of the data. Students construct a box-and-whisker plot of the class data. This...
Curated OER
Statistics: Quartiles and Percentiles
In this statistics worksheet, students examine a data set and identify the lower and upper quartiles. They determine percentile ranks of given material and compute the median of the data. This one-page worksheet contains ten problems.
Curated OER
Isosceles Triangle Theorems
In this isosceles triangle worksheet, students use theorems to determine if given triangles are congruent or not congruent. In addition, they identify the described triangles as isosceles or right. This one-page worksheet contains ten...
Curated OER
Independent Practice 1: Box and Whisker Plot
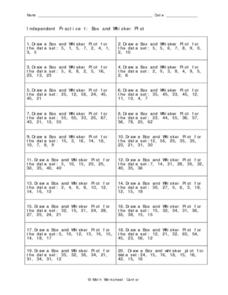
In this box and whisker plot instructional activity, students create a box and whisker plot from a given set of data. They identify the lower quartile, upper quartile, the mean, and outliers. This one-page instructional activity...
Curated OER
Mathematics Applications
In this annual percentage rate worksheet, 10th graders solve 4 different word problems that relate to determining the interest rate and balance due for each problem. They solve each problem using an annual percentage table when...
Curated OER
Probability and Statistics - Week 10
In this probability and statistics worksheet, students find compound dependent and independent probability of given situations. They identify the mean, mode, range and median of sets. This two-page worksheet contains explanations,...
Curated OER
Permutations and Combinations I
In this permutations and combinations worksheet, students read story problems and identify them as a permutation or combination. They select the correct formula and compute the answer to the problem. This one-page worksheet contains...
Curated OER
Probability - Week 6
In this probability worksheet, students solve complex probability problems containing logarithms, radicals, and square roots. This three-page worksheet contains nine problems.
Curated OER
Probability and Statistics
In this probability and statistics worksheet, high schoolers solve independent and dependent probability problems. They identify the mean, mode and range of a set of numbers. This two-page worksheet contains five probability problems.
Curated OER
Chapter 4, 8, 9, Review. Math 210 - Chance
In this chance worksheet, students determine the chance of an event happening. This two-page worksheet contains approximately seven multi-step word problems.
Curated OER
Mean, Median, and Mode 1
In this mean, median and mode worksheet, students use the measures of central tendency to describe given statistical data. Students identify the range of data, and match data to its representative bar graph. Two multi-step problems are...
Curated OER
Data Analysis 2
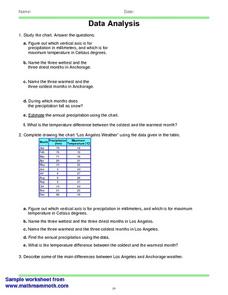
In this data analysis worksheet, students read and interpret given line graphs. They determine the range and average. This one-page worksheet contains five problems.
Curated OER
Chapter 7 Word Search
In this statistics worksheet, students locate and identify various vocabulary terms related to mathematics and statistics. There are seven words located in the puzzle to find.
Curated OER
Ms. Good Ch15-1 Word Search
In this economics worksheet, students locate and identify various vocabulary terms related to economics and statistics. There are 14 words/phrases located in the puzzle.
Curated OER
Histograms and Statistical Graphics
In this statistics worksheet, students solve 6 data problems. They construct a histogram of given data, they create a frequency polygon, and a stem and leaf diagram. Students create a dot plot and a pie chart for given data sets. On the...
Curated OER
Discovering Growth Patterns
In this statistics worksheet, students examine data on a variety of subjects related to growth patterns and apply the data to 4 different graphs.
Curated OER
Dubious Adoption Data
Young scholars analyze a graph from the New York City Administration for Children's Services that shows a significant increase in New York City adoptions after ACS was founded. They determine whether the graph supports ACS' claims and...
Curated OER
Finding a Line of Best Fit
Pupils engage in the practice of creating a scatter plot with the data obtained from measuring different resting heart rates. The data is used to create the table that is translated into a graph. The lesson gives instructions for the use...
Curated OER
Statistics
High schoolers log their computer usage hours. They determine the mean, median, mode and standard deviation of the collected data. They make a frequency histogram of the grouped data, both on graph paper, and on the TI 83+ graphing...


