Hi, what do you want to do?
Texas Instruments
Texas Instruments: General Quadratics, Cubics, and Quartics
This activity explores the characteristics of the graphs of quadratic, cubic, and quartic functions. The graphing calculator will be used to generate graphs and derivatives of these functions.
Other
Edumat: Geometria Interactive
In this section different interactive activities are presented which can be used as supplementary material to traditional classroom and allow for interactive study of mathematics.
Texas Instruments
Texas Instruments: Transforming Parabolas
1. Students will be able to review how to find the vertex of a parabola using a graphing calculator. 2. Students will be able to observe the relationship between the values of a, h and k and the graph of a parabola in vertex form. 3....
Integrated Publishing
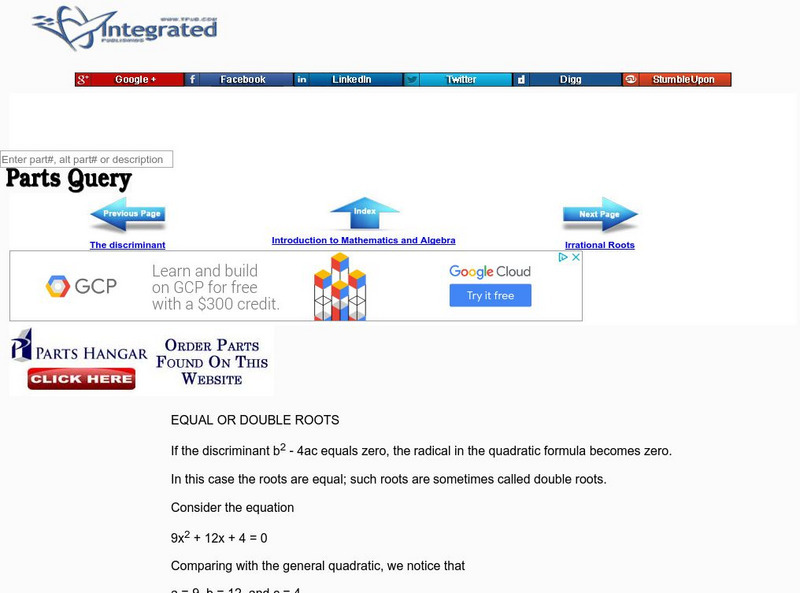
Internet Publishing: Equal or Double Roots
A demonstration of how to use a quadratic function's discriminant to determine if the function contains equal (double) roots, or real, unequal roots, and how to find them.
Math Graphs
Houghton Mifflin: Math Graphs: Fitting Models to Scatter Plots 1 [Pdf]
Students use a scatter plot to determine whether data can be modeled by a linear function, a quadratic function, a trigonometric function, or that there appears to be no relationship between x and y. The resource consists of an enlarged...
Math Graphs
Houghton Mifflin: Math Graphs: Fitting Models to Scatter Plots 2 [Pdf]
Students use a scatter plot to determine whether data can be modeled by a linear function, a quadratic function, a trigonometric function, or that there appears to be no relationship between x and y. The resource consists of an enlarged...
Math Graphs
Houghton Mifflin: Math Graphs: Fitting Models to Scatter Plots 3 [Pdf]
Students use a scatter plot to determine whether data can be modeled by a linear function, a quadratic function, a trigonometric function, or that there appears to be no relationship between x and y. The resource consists of an enlarged...
Math Graphs
Houghton Mifflin: Math Graphs: Fitting Models to Scatter Plots 4 [Pdf]
Learners use a scatter plot to determine whether data can be modeled by a linear function, a quadratic function, a trigonometric function, or that there appears to be no relationship between x and y. The resource consists of an enlarged...
Lawrence Hall of Science
The Math Page: Topics in Pre Calculus: Completing the Square
Here is a site that clearly and thoroughly explains how to solve quadratic equations by completing the square. The quadratic formula is derived using this method on this page. Point this site out to students who have been absent or who...
Texas Instruments
Texas Instruments: Writing Equations of Parabolas in Vertex Form
Students use their knowledge of the vertex form of a quadratic equation to graph parabolas, given a specific move to make.
Texas Instruments
Texas Instruments: Curve Ball
In this activity, students collect data for a bouncing ball using a motion detector. They analyze the data and attempt to find a model for the height of the ball as a function of time.
Texas Instruments
Texas Instruments: What Goes Up: Position and Time for a Cart on a Ramp
In this activity, students' will use a motion detector to measure how the position of a cart on a ramp changes with time. They will then determine a parabolic model for the position data using the intercepts.
Texas Instruments
Texas Instruments: Zeros of a Parabola
Students are introduced to an interesting property of parabolas and a method of proving that property using the TI-89 scripts. They then use the CAS of their TI-89 to generalize upon specific results.
Texas Instruments
Texas Instruments: Height and Time for a Bouncing Ball
In this activity, students' will record the motion of a bouncing ball using a motion detector. They will then model a bounce using both the general and vertex forms of the parabola.
Texas Instruments
Texas Instruments: Maximum, Minimum, Increasing, Decreasing
This StudyCard set is a teaching activity that uses real-world contexts to assist students in understanding the concepts of maximum, minimum, increasing, and decreasing.
Texas Instruments
Texas Instruments: The Slope of the Tangent Line (Part1)
In this activity, students use the CellSheet Application to approximate the slope of a line tangent to a curve.
Texas Instruments
Texas Instruments: Vernier a Speedy Slide With Easy Data App and Cbr 2
Students can use a CBR 2 motion detector to determine their speed or velocity going down a playground slide. They will also experiment with different ways to increase their speed going down the slide.
Texas Instruments
Texas Instruments: Car Stopping Distances
This activity uses the tranformation graphing application on the TI-84 calculator to discover the equation for the stopping distance of a car on dry pavement.
Math Graphs
Houghton Mifflin: Math Graphs: Fitting Models to Scatter Plots 7 [Pdf]
Learners use a given scatter plot to identify whether the data can be modeled by a linear, quadratic, or trigonometric function. The math graph is available in PDF format.
Math Graphs
Houghton Mifflin: Math Graphs: Fitting Models to Scatter Plots 8 [Pdf]
Learners use a scatter plot to identify whether the data can be modeled by a linear, quadratic, or trigonometric function. The math graph is available in PDF format.
CK-12 Foundation
Ck 12: Algebra: Logarithms
[Free Registration/Login may be required to access all resource tools.] This lesson defines and shows you how to use logarithms.
Other
Center for Technology and Teacher Education: Parabola Lesson Plan
This site is a lesson plan on construction of a parabola using the definition. Geometer's Sketch Pad software is beneficial for the lesson. Through the lesson students develop gemetric constructions of parabolas, use the distance formula...
Khan Academy
Khan: Lsn 8: Interpreting Relationships in Scatterplots/graphs/tables/equations
This lesson focuses on Interpreting and analyzing linear, quadratic, and exponential models and graphs. Students will use best fit lines to interpret contexts, distinguish whether contexts are linear or exponential functions, use the...
Khan Academy
Khan Academy: Lsn 13: Systems of Equations, Algebraic and Graphical Representations
Lesson 3 of 4 for Passport to Advanced Math. Learners will solve systems of equations in two variables in which one equation is linear and the other equation is quadratic or another nonlinear equation; relate properties of the function f...


