Curated OER
Why Did the Plum Divorce the Grape? What Did the Boy Tree Say to the Girl Tree?
For this solving inequalities worksheet, students graph and shade 15 inequalities. Students then use their shading to help answer the two riddles.
Curated OER
Function Families
In this function families worksheet, students graph 6 families of absolute value equations on a graphing calculator and transfer a sketch to graph paper. Students then answer 8 questions to identify the vertex.
Curated OER
Linear Inequalities
For this linear inequalities worksheet, students graph and shade 6 linear inequalities. Students then graph and shade 3 absolute value inequalities.
Curated OER
Data Analysis Self-Test
In this data analysis worksheet, students complete 1 problem that has 7 parts involving mean, median, mode, range, and quartiles. Students then perform 5 operations with matrices.
Curated OER
Scatterplots
In this scatterplots worksheet, students construct a scatter plot from a given data set. Students then answer 4 questions regarding the least-squares regression line and making predictions.
Curated OER
Stemplots
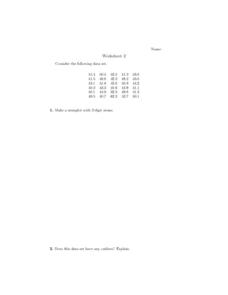
In this stem plot worksheet, learners construct 3 stem plots. Students answer 1 question about outliers and another question regarding which stem plot is preferred.
Curated OER
Parabolas
In this parabolas worksheet, 10th graders solve and complete 15 different problems related to parabolas. First, they define parabola and its information related to graphing one. Then, students write each equation in standard form. They...
Curated OER
Integers and the Number Line
In this integers and number line activity, students complete 10 problems by naming the set graphed. Students graph 6 number sets. Then students answer 6 sum problems.
Curated OER
Testing for Catalase Activity
For this catalase worksheet, students read about how enzymes work in cells. Then students conduct an experiment to test for catalase activity in potatoes. This worksheet has 1 graph and 6 short answer questions.
Curated OER
Plant Inspection Lab
In this IPM inspection learning exercise, students complete a chart observing the phenological events that are observed at each stage of various plants' development.
Curated OER
The Effects of Unions on Wages And Employment in Competitive And Monopsonistic Labor Markets
In this economics worksheet, students examine the effects of unions and wages on employment in competitive and monopolistic labor markets by comparing and contrasting two labor markets and answering seven questions.
Curated OER
Measuring Lung Volume and Capacity
In this measuring lung volume and capacity worksheet, students perform several experiments testing for exhaled carbon dioxide, measuring lung volume, and measuring lung capacity.
Curated OER
Graphing Monetary And Fiscal Policy Interactions
In this economics worksheet, students draw aggregate demand and supply curves for 3 monetary and fiscal policy combinations.
Curated OER
Equilibrium Prices And Equilibrium Quantities
In this economics worksheet, students plot data regarding the demand for the supply of a product and answer 6 detailed fill in the blank/multiple choice questions regarding market prices and quantities.
Curated OER
Demand curves, Moves Along Demand Curves, and Shifts in Demand Curves
In this economics worksheet, students study a data chart, plot the demand of a hypothetical product, and complete 3 fill in the blank questions. They then study two more demand charts and respond to 3 multiple choice questions and 1...
Curated OER
Relations
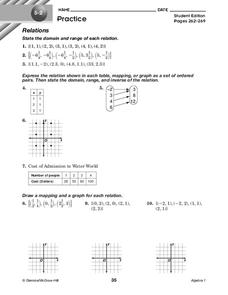
In this relations worksheet, 10th graders solve and complete 10 different problems that include defining various forms of relations. First, they state the domain and range of each relation. Then, students express the relation shown in...
Curated OER
Relations
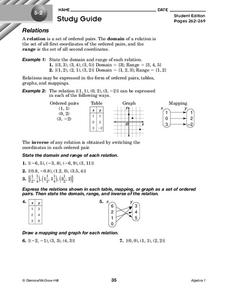
In this relations learning exercise, 10th graders solve and complete 7 different problems that include defining various relations of number sets. First, they state the domain and range of each relation. Then, students express the...
Curated OER
Graphing Systems of Inequalities
In this graphing systems of inequalities worksheet, students solve and graph 8 systems of inequalities. One problem includes an absolute value.
Curated OER
Systems of Inequalities
In this graphing systems of inequalities instructional activity, students solve and graph 4 inequalities with the help of a computer. Students solve 2 more systems of inequalities using the calculator.
Curated OER
Graphing Systems of Inequalities
In this systems worksheet, students solve 6 systems of inequalities by graphing. Students then write 1 systems of inequalities for a given graph.
Curated OER
Battle Ship
In this coordinate plane worksheet, 10th graders solve and graph 3 different problems that include playing a game with graphing. First, they mark one of each of they ships either horizontally or vertically. Then, students call out a...
Curated OER
Graphing Linear Equations
In this linear equations instructional activity, students graph 2 linear equations using x- and y- intercepts. Students then graph 2 additional equations using the slope and y-intercept method.
Curated OER
Graphing 3 Ways
In this graphing worksheet, students graph 10 equations using the following methods: slope-intercept form, x- and y-intercepts, or by using a table. Students check their work using a graphing calculator.
Curated OER
Graphing Inequalities in Two Variables
In this graphing inequalities worksheet, students shade 3 inequality problems. Students then graph and shade 4 additional inequalities.


