College Board
1998 AP® Statistics Free-Response Questions
Free-response questions form the 1998 AP® Statistics exam allow class members to analyze data from real-life situations. The situations include tracking defective parts, tracking butterflies, evaluating weed killers and determining...
College Board
2005 AP® Statistics Free-Response Questions Form B
Here's another great way to learn from the past. Released free-response questions provide a look into how concepts measured on the 2005 AP® Statistics Exam on Form B. Teachers and pupils review questions that cover concepts such as...
Radford University
Environmental Issues
Pupils investigate the air pollution situation in China by fitting a curve to historical data. They dig deeper into environmental issues that are of interest and provide a mathematical analysis of the issue. Class members develop a route...
Radford University
Government Spending
Spend some time with lines of best fit. An informative unit has learners investigate government spending. They research data on poverty, educational spending, social security, and defense spending, and then analyze lines of best fit for...
Radford University
Exploring Equations through Life Goals
What do I want to do when I grow up? Learners research job categories and determine a career within the category. Using the chosen job, pupils find the hourly wage and calculate future income based on percentage wages. Individuals then...
Radford University
Animal Decline
Where did they all go? Small groups collect data on different animal species that are on a decline. Teams develop equations to model the populations over time and then create presentations about the decline of their animals. Classmates...
Radford University
Is it Really a Small World After All?
Working in groups, learners research four countries' populations over the past 30 years. Using the data collected, the teams find regression equations that best fit the data. Taking the regression equations, they then make predictions...
Curated OER
Lines of Fit
Students graph an equation and analyze the data. In this algebra instructional activity, students graph scatter plots and identify the line of best fit using positive correlation, negative correlation an d no correlation. They apply...
Curated OER
Super Bowl Champs
For this Super Bowl worksheet, students create line plots of all winners and losers of the Super Bowl. They create stem-and-leaf plots, scatter plots, and bar graphs of football data. This one-page worksheet...
Curated OER
Geometric Sequences and Series
Learners find common ratios of geometric sequences on a spreadsheet. Using this data, they create scatter plots of the sequences to determine how each curve is related to the value of the common ratio. They will consider whether series...
Curated OER
A Closer Look: Unemployment
Students view a video clip about unemployment. They research data and create a scatter plot graph. They discover the importance of graphs and what they can tell us. They create their own publication on unemployment.
Curated OER
Rhinos and M&M's
Students analyze patterns of exponential models by collecting data in paper folding and M&M investigations. They use graphing calculators to create scatter plots that lead to equations for the exponential models. They then apply this...
Curated OER
Strike a Pose: Modeling in the Real World (There's Nothing to It!)
Adjust this activity to fit either beginning or more advanced learners. Build a scatter plot, determine appropriate model (linear, quadratic, exponential), and then extend to evaluate the model with residuals. This problem uses...
Curated OER
Lines of Fit
Students graph an equation and analyze the data. In this algebra lesson plan, students graph scatter plots and identify the line of best fit using positive correlation, negative correlation an d no correlation. They apply their data...
Curated OER
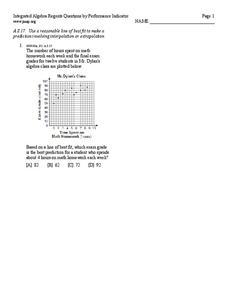
Line of best fit
In this Algebra I/Algebra II worksheet, young scholars determine the line of best fit for a scatter plot and use the information to make predictions involving interpolation or extrapolation. The one page worksheet contains one...
Curated OER
Algebra Nomograph
Investigation of a nomograph teaches students to determine the rule of a function by examining the input and output values. Students use a nomograph on their Ti-Nspire to determine the function rule. Students make a scatter...
Curated OER
Lines of Fit
Students solve equations dealing with best fit lines. In this algebra lesson, students solve problems by analyzing data from a scatterplot, and define it as positive, negative or no correlation. They classify slopes the same way as...
Curated OER
Properties of Logarithms
Students explore the concept of logarithms. In this logarithms instructional activity, students graph logarithms on their Ti-Nspire calculator. Students describe the shapes of their graphs by identifying slope, y-intercepts,...
Curated OER
Logistic Growth
Through the exploration of population growth of a bacteria population, learners learn about and observe bacteria population over a 20 hour period. Students graph the population growth using a scatter plot and discuss its logistic...
Curated OER
A Tall Story
High schoolers investigate the growth rate of a man named Bob Wadlow. In this growth rate of a man lesson, students determine if the growth rate of this particular man was normal or abnormal. High schoolers bring in data of...
Curated OER
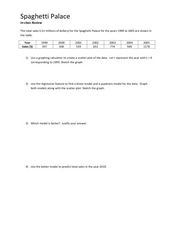
Spaghetti Palace
In this spaghetti palace worksheet sheet, students examine data and create a scatter plot. They use their graphing calculator to find a linear model and a quadratic model for given information. Students predict total...
Texas Instruments
Graphing Calculator Investigation Graphs of Relations
Learners investigate relations in this algebra lesson. They graph the set of ordered pairs that determine a relation. Using a TI-83 Plus, your learners will enter the coordinates in a list, create a scatter plot, and manipulate the...
Curated OER
Lines of Fit
Learners analyze graphs. For this algebra lesson, students find the line of best fit, using scatter plots. They calculate the sale of popcorn as it relates to the price. They then analyze the graphs for positive, negative and no...
University of Georgia
Using Freezing-Point Depression to Find Molecular Weight
Explore the mathematical relationship between a solvent and solute. Learners use technology to measure the cooling patterns of a solvent with varying concentrations of solute. Through an analysis of the data, pupils realize that the...
