Curated OER
Lines of Best Fit
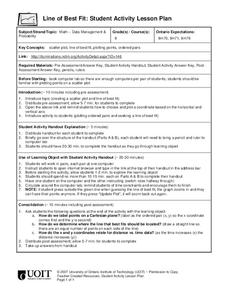
High schoolers explore the concept of line of best fit. In this line of best fit lesson, students find lines of best fit in examples about riding your bike home from school and dentistry. High schoolers find two data points and find the...
Curated OER
Little Red Corvette
Students investigate the acceleration of a car. In this acceleration of a car lesson plan, students make a scatter plot of corvette acceleration data. Students find a model to fit the data by taking the integral of the curve...
Curated OER
Commercial Salmon Fishing
Students work with data about commercial fishing ofsalmon in Alaska. Students gather data, graph it, and analyze it.
Curated OER
Line of Best Fit
Students calculate the equation of the line of best fit. In this statistics lesson plan, students create scatter plots and find the line of best fit going through their data. They make predictions and draw conclusions.
Curated OER
Finding a Line of Best Fit
Pupils engage in the practice of creating a scatter plot with the data obtained from measuring different resting heart rates. The data is used to create the table that is translated into a graph. The lesson plan gives instructions for...
Curated OER
Algebra II: Quadratic Functions
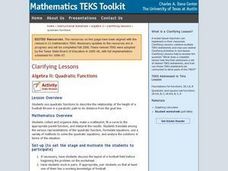
Students collect and organize data, make a scatterplot, fit a curve to the appropriate parent function, and interpret the results. Students translate among the various representations of the quadratic function, formulate equations, use a...
Curated OER
Integrated Algebra
In this integrated algebra worksheet, students solve problems covering topics studied during the year. Problems include topics such as slope-intercept, Venn Diagrams, finding the solution to multi-step algebra problems, writing...
Curated OER
Graphing Data Brings Understanding
Students collect, graph and analyze data. For this statistics lesson, students use circle, pie, bar and lines to represent data. They analyze the data and make predictions bases on the scatter plots created.
Curated OER
Linear and Exponential Models
Students investigate the differences between linear and exponential models. In this linear and exponential models instructional activity, students make a table of given data. Students determine if the data is linear or...
Kenan Fellows
Lego Thinking and Building
Run a simulated airplane manufacturing plant with your pupils as the builders! Learners build Lego airplane models and collect data on the rate of production, comparing the number produced to the number defective. Using linear...
Curated OER
Test On Analytic Geometry/ Play Green Globs
High schoolers engage in a instructional activity that focuses on analytic geometry. The instructional activity asked them to apply skills of relating equations when plotting them on the coordinate plane. Students construct the equations...
Curated OER
Handy Reflections
Learners explore reflections on a coordinate plane in this lesson. They trace their hand on a grid, determine the coordinates of each point, and create a scatter plot of their points. Pupils use this information to investigate aspect...
Curated OER
Histograms and Statistical Graphics
In this statistics worksheet, young scholars solve 6 data problems. They construct a histogram of given data, they create a frequency polygon, and a stem and leaf diagram. Students create a dot plot and a pie chart for given data sets....
Curated OER
Algebra 2 - Linear Programming
Pupils read real world problems, determine the variables, and set up the function using algebraic statements. After entering data into the graphing calculator, they display information in the form of graphs and scatter plots. Students...
Curated OER
Statistical Diagrams
In this statistics worksheet, students explore five activities that require analysis and interpretation of maps, charts, and scatter plots. The six page lesson includes five activities or experiments with short answer...
Curated OER
Investigating Correlation
High schoolers investigate different types of correlation in this statistics lesson. They identify positive, negative and no correlation as it relates to their data. They then find the line of best fit for the plotted data.
Curated OER
Exploring Diameter and Circumference
Learn how to identify the diameter and circumference of a circle. Then, collect data on a circle and relate it to the diameter and circumference of a circle. Last, plot data and find the line of best fit.
Curated OER
Sports Data for the Classroom
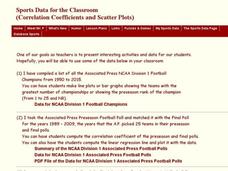
In this algebra worksheet,students rewrite word problems using algebraic expressions. They collect data and plot their findings on the graph and analyze it. There is an answer key for this worksheet.
Curated OER
Graphs
Students explore graphs and define the different ways they are used to display data. In this algebra lesson plan, students collect data and plot their data using the correct graph. They draw conclusions from their graphs based on their...
Virginia Department of Education
Exponential Modeling
Investigate exponential growth and decay. A set of six activities has pupils collecting and researching data in a variety of situations involving exponential relationships. They model these situations with exponential functions and solve...
Virginia Department of Education
Linear Modeling
An inquiry-based algebra lesson plan explores real-world applications of linear functions. Scholars investigate four different situations that can be modeled by linear functions, identifying the rate of change, as well as the...
Curated OER
Black Out
Students collect and analyze data. In this statistics lesson, students plot their data on a coordinate plane and find the line of best fit. They calculate the linear regression using the data.
Curated OER
Unit 13: Graphs, Correlation, Line of Best Fit
Students explore the concepts of graphs, correlations, line of best fit, and the dipstick problem. In this graph, correlation, line of best fit and dipstick problem lesson, students solve problems on the above mentioned topics. ...
Texas Instruments
Say What You Mean!
Young scholars analyze data and identify the mean. In this probability lesson, students log data in the TI and construct scatter plots from the data. They identify properties of a scatterplot.


