Hi, what do you want to do?
Curated OER
Collecting Data to Learn About the People Around You
Human graphs, anyone? Did you eat fruit today? What is your favorite costume? Have your K – 6 learners graph the responses. Early elementary grades may count and compare while upper grades compare responses of different groups or make...
Curated OER
Quick Questions
Students ask their classmates survey questions. In this survey lesson, students come up with a question and possible answers. Their classmates mark their answers and the class discusses what they notice.
Curated OER
We Care About Fire Safety
Students investigate the hazards of fires and how to best protect themselves and their family. In this home safety lesson, students examine the importance of a smoke detector and discover how many homes are missing them among their...
Curated OER
Graphing Our Favorite Candy Bars
Young scholars use ClarisWorks to graph class' favorite candy bars on a bar graph.
Annenberg Foundation
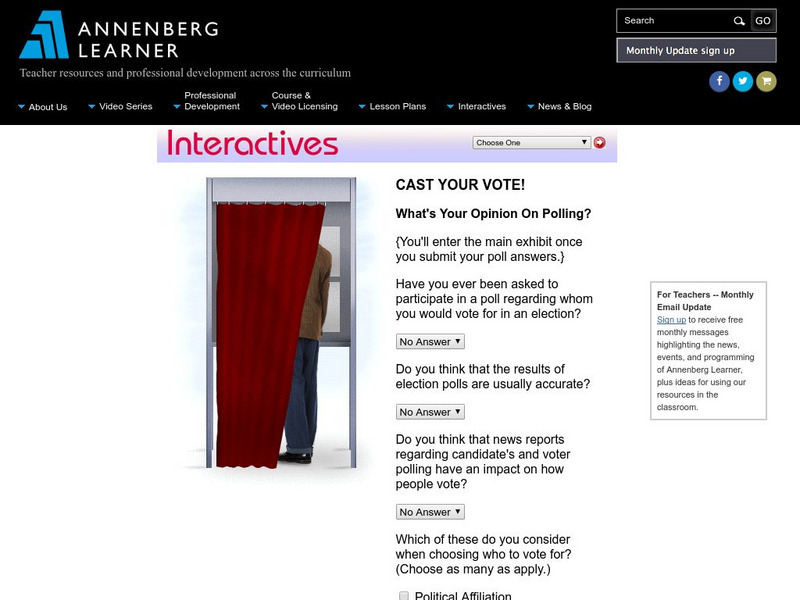
Annenberg Learner: Interactives: Cast Your Vote!
Upper elementary, middle, and high school students can use this exhibit to get an understanding of how polls and elections are conducted. The discussion includes random samples, margins of error, and other concepts related to statistics.


