Mathematics Assessment Project
Interpreting Distance–Time Graphs
Pre-algebra protégés critique a graph depicting Tom's trip to the bus stop. They work together to match descriptive cards to distance-time graph cards and data table cards, all of which are provided for you so you can make copies for...
Columbus City Schools
Speed Racers
Who wants to go fast? The answer? Your sixth-grade science superstars! The complete resource offers the ultimate, all-inclusive playbook for mastering the important concepts of speed versus time; distance versus time; and how...
Illustrative Mathematics
Velocity vs. Distance
At the end of this activity, your number crunchers will have a better understanding as to how to describe graphs of velocity versus time and distance versus time. It is easy for learners to misinterpret graphs of velocity, so have them...
Kenan Fellows
Analyzing Speed from Different Modalities
Show us your moves. Using sensor equipment, scholars track the motion of different movements, such as jogging, skipping, or jump roping. They analyze velocity and acceleration and create graphs representing each movement.
Curated OER
Drive the Data Derby
Three days of race car design and driving through the classroom while guessing probability could be a third graders dream. Learn to record car speed, distances traveled, and statistics by using calculation ranges using the mean, median,...
Illustrative Mathematics
Bike Race
A graph not only tells us who won the bike race, but also what happened during the race. Use this resource to help learners understand graphs. The commentary suggests waiting until the end of the year to introduce this topic, but why...
EngageNY
Graphs of Piecewise Linear Functions
Everybody loves video day! Grab your class's attention with this well-designed and engaging resource about graphing. The video introduces a scenario that will be graphed with a piecewise function, then makes a connection to domain...
Radford University
Midsummer Classic’s Homerun Derby
Hit a home run with your lessons. A two-part activity has learners explore quadratic equations that model the path of a baseball. They see how changing the initial speed of the ball affects its maximum height, maximum horizontal...
101 Questions
Scrambler
Unscramble a carnival mystery! Scholars observe a video of an overhead view of a carnival ride, The Scrambler. They then must determine mathematically where a specific car will stop after a certain amount of time.
Curated OER
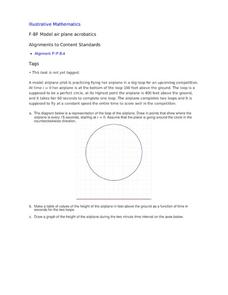
Model Air Plane Acrobatics
Your young airplane enthusiasts will enjoy this collaborative task of graphing an airplane's distance from the ground as it flies in a perfect circle. They will discover that they have graphed a sinusoidal function that comes from the...
EngageNY
Constant Rates Revisited
Find the faster rate. The resource tasks the class to compare proportional relationships represented in different ways. Pupils find the slope of the proportional relationships to determine the constant rates. They then analyze the...
National Council of Teachers of Mathematics
Varying Motion
For this secondary mathematics learning exercise, high schoolers collect data based on a person’s motion. From this data, learners create graphs comparing displacement, velocity, and acceleration to time. The five-page learning exercise...
Curated OER
Dragonfly
The speed of a dragonfly brings math into the real world as your learners collaboratively see the value in calculating unit rates in direct proportion problems. This six-phase lesson encourages you, as the teacher, to only ask questions...
NASA
Measuring Dark Energy
You're only 10 minutes late? Do you know how much the universe has expanded in those 10 minutes? Scholars graph supernovae based on their redshift and see if the results verify Hubble's Law. If it does confirm it, the universe is...
Illustrative Mathematics
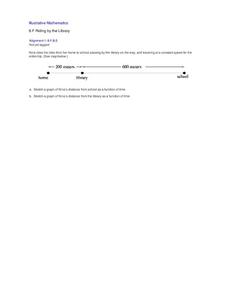
Riding by the Library
Draw a graph that shows the qualitative features of a function that has been described verbally. Make sure learners understand where time is zero and the distance is zero. It may take them some time to understand this concept, so working...
Texas Instruments
Vandalism 101
Learners explore logic and use Geometer’s Sketchpad and patterns of logic to solve a puzzle.


