EngageNY
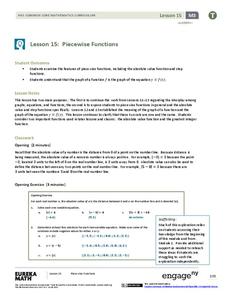
Piecewise Functions
Show your class members that if they can graph a linear function, they can graph an absolute value function. Groups create an absolute value graph using a table, then entertain the idea of an absolute value function defined as two...
EngageNY
Graphing the Logarithmic Function
Teach collaboration and communication skills in addition to graphing logarithmic functions. Scholars in different groups graph different logarithmic functions by hand using provided coordinate points. These graphs provide the basis for...
EngageNY
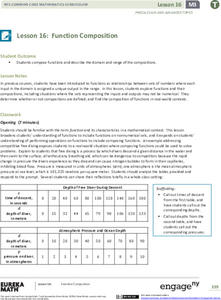
Function Composition
Combine functions for the first time. Pupils investigate composition of functions using a function table and then function machines in the 17th installment in a 23-part Precalculus series. Scholars learn the two notations for composition...
Curated OER
A Sum of Functions
Collaborative learners will see the geometric addition of functions by graphing the sum of two graphed curves on the same coordinate plane. This task then naturally flows into giving learners the algebraic representation of the curves...
Education Development Center
Creating a Polynomial Function to Fit a Table
Discover relationships between linear and nonlinear functions. Initially, a set of data seems linear, but upon further exploration, pupils realize the data can model an infinite number of functions. Scholars use multiple representations...
EngageNY
Four Interesting Transformations of Functions (Part 1)
Understanding how functions transform is a key concept in mathematics. This introductory lesson makes a strong connection between the function, table, and graph when exploring transformations. While the resource uses absolute value...
EngageNY
Comparing Linear and Exponential Models Again
Making connections between a function, table, graph, and context is an essential skill in mathematics. Focused on comparing linear and exponential relationships in all these aspects, this resource equips pupils to recognize and interpret...
EngageNY
Graphing the Tangent Function
Help learners discover the unique characteristics of the tangent function. Working in teams, pupils create tables of values for different intervals of the tangent function. Through teamwork, they discover the periodicity, frequency, and...
Curated OER
Monster Frog Function Machine
Elementary schoolers use a function machine in order to help them look at the relationship between input and output, and to look at the rule for the change. The machine is actually a cardboard box, and it serves quite well for the lesson...
EngageNY
Properties of Trigonometric Functions
Given a value of one trigonometric function, it is easy to determine others. Learners use the periodicity of trigonometric functions to develop properties. After studying the graphs of sine, cosine, and tangent, the lesson connects...
Mathematics Vision Project
Module 5: Features of Functions
The language and features of functions get careful treatment in a complex but doable lesson. Learners get a lot of practice really figuring out what a graph means in context, and also identifying key features of graphs. Key ideas...
Mathematics Assessment Project
Representing Quadratic Functions Graphically
Sometimes being different is an advantage. An engaging activity has scholars match cards with quadratic functions in various forms. Along the way, they learn about how each form highlights key features of quadratic functions.
EngageNY
Modeling a Context from a Verbal Description (part 1)
When complicated algebraic expressions are involved, it is sometimes easier to use a table or graph to model a context. The exercises in this lesson are designed for business applications and require complex algebraic...
EngageNY
The Height and Co-Height Functions of a Ferris Wheel
Show learners the power of mathematics as they model real-life designs. Pupils graph a periodic function by comparing the degree of rotation to the height of a ferris wheel.
SHS Algebra
Linear vs. Exponential Functions Tasks
Your algebra learners will enjoy the real-life application of the three tasks presented here. They complete a table and a graph comparing the two options presented. One option is linear, while the other is exponential. After coming up...
Curated OER
What Functions do Two Graph Points Determine?
Your algebra learners write linear, exponential, and quadratic equations containing the same two graph points in this collaborative task.
Mathematics Vision Project
Connecting Algebra and Geometry
Connect algebra and geometry on the coordinate plane. The eighth unit in a nine-part integrated course has pupils develop the distance formula from the Pythagorean Theorem. Scholars prove geometric theorems using coordinates...
EngageNY
Relationships Between Quantities and Reasoning with Equations and Their Graphs
Graphing all kinds of situations in one and two variables is the focus of this detailed unit of daily lessons, teaching notes, and assessments. Learners start with piece-wise functions and work their way through setting up and solving...
EngageNY
Modeling a Context from Data (part 2)
Forgive me, I regress. Building upon previous modeling activities, the class examines models using the regression function on a graphing calculator. They use the modeling process to interpret the context and to make predictions...
EngageNY
From Ratio Tables, Equations and Double Number Line Diagrams to Plots on the Coordinate Plane
Represent ratios using a variety of methods. Classmates combine the representations of ratios previously learned with the coordinate plane. Using ratio tables, equations, double number lines, and ordered pairs to represent...
Annenberg Foundation
Skeeters Are Overrunning the World
Skeeters are used to model linear and exponential population growth in a wonderfully organized lesson plan including teachers' and students' notes, an assignment, graphs, tables, and equations. Filled with constant deep-reaching...
University of North Texas
Math Exam 1 Review
Perfect as a review guide, this worksheet provides a range of questions focusing on functions. Topics include composing functions, transformations, domains, and polynomials. Also included are corresponding worksheets focusing on other...
EngageNY
Analyzing a Data Set
Through discussions and journaling, classmates determine methods to associate types of functions with data presented in a table. Small groups then work with examples and exercises to refine their methods and find functions that work...
EngageNY
Analyzing a Verbal Description
What function will describe the insect population growth? Pairs or small groups work together to determine which type of function and specific function will model given scenarios. The scenarios differentiate between linear,...


