Curated OER
Twelve Days of Christmas--Prediction, Estimation, Addition, Table and Chart
Scholars explore graphing. They will listen to and sing "The Twelve Days of Christmas" and estimate how many gifts were mentioned in the song. Then complete a data chart representing each gift given in the song. They also construct...
Curated OER
Our Favourite Halloween Treat
Students conduct a survey about Halloween candy and create a bar graph illustrating the data. In this data analysis lesson, stud nets are introduced to the topic with a discussion and survey, then the class creates a large graph and...
Curated OER
Sort the Compost Bin
Students discover what compost is. In this composting instructional activity, students view a sample of a compost bin and define what the purpose of compost is. Students discuss what the compost bin consists of and sort the compost bin...
Curated OER
Mystery Graphs
Learners study graphs and learn how to display information into a graph. In this graph lesson plan, students construct a graph of their own sorted data, and pick out things in graphs that are inconsistent.
Curated OER
Beach Cleanup at a Local Beach
Students participate in an environmental clean-up activity. In this environmental lesson, students travel to a local beach. Working in small teams, students collect trash from the local beach. Returning to school, students sort the trash...
Curated OER
Build A Skittles Graph
Students explore graphing. In this graphing activity, students sort Skittles candies and use the color groups to create a bar graph. Rubrics and extension activities are provided.
Curated OER
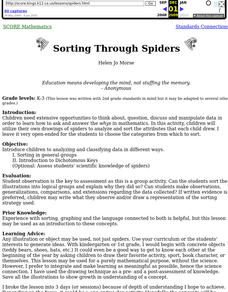
Sorting Through Spiders
Students utilize their own drawings of spiders to analyze and sort the attributes that each student drew.
Curated OER
M & M Madness
Students work with the mathematics unit of collection, organization, and presentation of data. In this math and technology lesson plan, students use Valentine M & M’s and The Graph Club to sort and graph the various colored M & M’s.
Alabama Learning Exchange
How Old is Your Money?
Elementary learners explore coin mint dates. First, they listen to the book Alexander Who Used to be Rich Last Sunday by Judith Viorst. They then sort a collection of coins according to their mint date and put them in order from oldest...
Curated OER
Bugs, Bugs, Everywhere!
Young scholars collect and compare bugs using magnifying lenses and graph data based on their comparisons. In this bugs lesson plan, students also make an aspirator by using a jar, tubing, and screen.
Alabama Learning Exchange
Yummy Apples!
Young learners listen to a read aloud of Gail Gibbons book, Apples and the story A Red House With No Windows and No Doors. They compare characteristics of a number of kinds of apples, graph them and create a apple print picture. Learners...
Curated OER
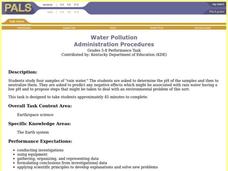
Water Pollution
Students study four samples of "rain water". They asked to determine the pH of the samples and then to neutralize them. Students are asked to predict any negative effects which might be associated with water having a low pH and to...
Curated OER
Graphing Favorite Fruit
Third graders take poll and sort data, enter the data to create a spreadsheet and create bar and pie graphs.
Curated OER
Wonderful Watermelons
First graders explore watermelons and collect and sort their seeds. In this watermelons lesson plan, 1st graders read the story Down By The Bay and then weigh, measure, collect seeds, sort, and eat their watermelon.
Curated OER
Fruit Loop Graphing
Fifth graders interpret data and create graphs. Given Fruit Loops, they sort and classify according to color. Using spreadsheet technology, 5th graders record their data and create bar and circle graphs. Students analyze data and...
Curated OER
For the Record: Black Inventors and Inventions
Students research the Internet for information about African-American inventors and their inventions. After collecting their data, students must build and manage information in a database that catalogs the inventions of African-Americans.
Curated OER
Family Vacation
Students use math to plan a trip by houseboat down the Mississippi River. They research and obtain information on the Mississippi River and its surroundings and use multiple graphs to represent their data.
Curated OER
Is the Rainbow Fair?
Third graders perform statistical calculations. Given a bag of Skittles, 3rd graders sort and collect data regarding the colors included in their bag. Using spreadsheet software, students create a bar graph of the information collected....
Curated OER
Weather "Why"
Students research weather and explore how to use their research information. In this weather information instructional activity, students visit a given website for weather forecasts. Students graph the weather, sing weather songs and...
Curated OER
Put Your Heart Into It
First graders sort Valentine candies according to kind. Data is inserted into a spreadsheet and displayed in various graphic formats.
Curated OER
Wings and Othe Things
Students work in groups that are engaged in different activities at different times. They watch the video "Madagascar" and collect data pertaining to the Fish Eagle's arm spam. They work together to perform mathematical computations...
Curated OER
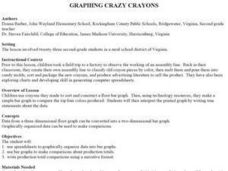
Graphing Grazy Crayons
Children create crazy crayons they made to sort and construct a floor bar graph. Then, using technology resources, they make a simple bar graph to compare the top four colors produced. Students will then interpret the printed graph by...
Curated OER
The Five Senses
Study various objects and help kindergarteners use their five senses to classify the objects. They are presented with various objects and then use their five senses to sort and classify the objects. Then they use a Visual Ranking Tool to...
Curated OER
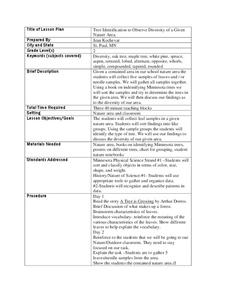
Tree Identification to Observe Diversity of a Given Nature Area
For this tree identification lesson, 2nd graders read A Tree is Growing, discuss what makes up a forest, brainstorm characteristics of leaves, gather samples of leaves and examine their samples. Students will sort leaves and compare them...


