Curated OER
"Lucky Charms": Interpreting Data and Making Predictions
Seventh graders determine if a "lucky charm" will increase their chances of winning a game. Students calculate the experimental probability of each player in a game. They observe and collect data from each activity. Students compare the...
Curated OER
TV Weather Announcers
Elementary schoolers collect and record weather data for their local area using data from newspapers, Web sites, and television reports. The read and record data daily, and groups prepare a presentation on their findings for the entire...
Curated OER
Beach Cleanup at a Local Beach
Students participate in an environmental clean-up activity. In this environmental instructional activity, students travel to a local beach. Working in small teams, students collect trash from the local beach. Returning to school,...
Curated OER
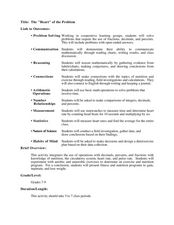
The "Heart" of the Problem
Students explore mathematical operations while studying nutrition. In this physical fitness lesson, students explore calories, pulse rate, and the circulatory system. Students use mathematical data to create a healthy physical fitness...
Curated OER
The Power of Graphical Display: How to Use Graphs to Justify a Position, Prove a Point, or Mislead the Viewer
Analyze different types of graphs with learners. They conduct a survey and determine the mean, median and mode. They then identify different techniques for collecting data.
Curated OER
Lesson: Culture & Change
Can a palace door be art? Can it facilitate an understanding of people and places? It certainly can! Using a palace facade as a lesson catalyst, kids will discuss geometric patterns, the kingdom of Swat, and geopolitical themes. They...
Curated OER
Create a Graph Online
Scholars create colorful bar, line, or pie graphs. They decide on a survey question to ask or a type of data to gather. From there, they collect information and data. They display this data in bar, line, or pie graphs that they create...
Curated OER
Bird Feeding and Migration Observation
Students research bird migration and build a bird house. In this bird lesson plan, students research the birds in their area and where they migrate to. They also build their own bird house and record data on what kinds of birds come to...
Curated OER
Do Not Open Until May 2000!
Students create a time capsule. In this time capsule lesson plan, students collect and record data about themselves to be stored in a time capsule that will be opened at the end of the year.
Curated OER
Race the Track! Jump the Gap
Students record data of using a track system with variables and how those variables affect a ball used in the track. In this track lesson plan, students design their own track in groups, test the ball's rates of speed, and record their...
Curated OER
Veggie Chop and Data Analysis
First graders chop vegetables into fractions. In this fractions lesson, 1st graders cut vegetables, collect data about favorite vegetables and create a bar graph using the information. Students make inferences about the data and record...
Curated OER
Twelve Days of Christmas--Prediction, Estimation, Addition, Table and Chart
Scholars explore graphing. They will listen to and sing "The Twelve Days of Christmas" and estimate how many gifts were mentioned in the song. Then complete a data chart representing each gift given in the song. They also construct...
Curated OER
Classroom Census (Analyzing Data)
Students create graphs. In this data analysis lesson, students fill out a student census and then use the data collected to produce graphs. Students write paragraphs interpreting the data.
Curated OER
State Names: Frequency
Data grathers determine the frequency of specified data. They identify the frequency that specified letters occur in the names of all 50 states. They create stem-and-leaf plots, box-and-whisket plots and historgrams to illustrate the data.
Intel
What Does This Graph Tell You?
What can math say about natural phenomena? The fifth STEM lesson in this project-based learning series asks collaborative groups to choose a phenomenon of interest and design an experiment to simulate the phenomenon. After collecting...
Curated OER
What Color Are Your Skittles?
Students create spreadsheets and manipulate data. They collect data, create appropriate graphs and use percentages to describe quantities. Students compare and contrast data. They use spreadsheets to generate a pie chart.
Curated OER
Hands on Habitat
Students teach others about habitats. In this Science lesson, students use a Science Log to record data about a habitat for research. Students analyze the data and construct an eco-chamber. Students share what they have found with other...
Alabama Learning Exchange
How Old is Your Money?
Elementary learners explore coin mint dates. First, they listen to the book Alexander Who Used to be Rich Last Sunday by Judith Viorst. They then sort a collection of coins according to their mint date and put them in order from oldest...
Curated OER
Pike Problems in Lake Davis
Pike fish pose a threat to native trout and catfish in lakes. Would you drain and poison a lake to get rid of the Pike fish? If the lake was drained and poisoned, then refilled and repopulated with trout and catfish, how would you...
Radford University
Let's Buy a Car
Ready to buy a car? Learners research different makes and models of cars to decide on the best one to buy. They collect data on cost, fuel efficiency, safety ratings, and insurance costs, then create and analyze data displays to make...
Curated OER
Rainforest (Elementary, Social Studies)
Explore the rainforest with your class. Learners study the meaning of the word endangered, choose an animal to study, gather data, and discuss why the animal is in danger of extinction. This is a motivating way to have your class discuss...
Curated OER
Cyberspace Safari
Middle schoolers go on an information gathering hunt on the Internet to study West African empires. They work in teams; meteorologists, bankers, writers, and archaeologists. They collect data on all sorts of topics related to West...
Curated OER
Discovering Local Food Chains
Fourth graders study about food chains. With the assistance of a local biologist, Students hike the school trail system. They explore ecosystem and collect data by charting the organisms found and identifying the energy source. They...
University of Minnesota
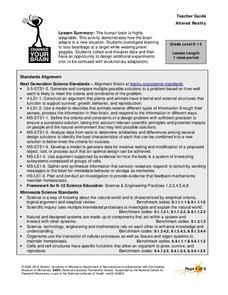
Altered Reality
Fascinate young life scientists by showing them how their brain learns. By using prism goggles while attempting to toss bean bags at a target, lab partners change their outlook on the world around them, producing amusing results....
Other popular searches
- Collecting and Recording Data
- Collecting and Organizing Data
- Collecting and Graphing Data
- Collecting and Using Data
- Games on Data Collecting
- Collecting Weather Data
- Collecting and Comparing Data
- Patterns Data Collecting
- Math Data Collecting
- Patterns, Data Collecting
- Collecting and Charting Data
- Patterns\, Data Collecting


