Curated OER
Fun with Math using Magnetic Force
Sixth graders explore and discuss the effectiveness of magnets in different situations. For this math lesson, 6th graders discuss rate and graphs after exploring with magnets using different restrictions on the magnets. They analyze...
Curated OER
Atlatl Lessons Grades 4-12: Lesson for Beginning Users of Atlatl
Sixth graders determine the mean, range median and mode of a set of numbers and display them. In this data lesson students form a set of data and use computer spreadsheet to display the information. They extend of the process by looking...
Curated OER
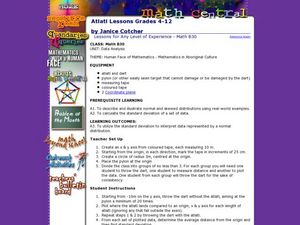
Human Face of Mathematics - Mathematics in Aboriginal Culture
Young scholars collect statistical data. In groups, students play a dart game and then determine the distance between darts. They collect the data and plot the information on a coordinate plane. They identify the mean and the standard...
Curated OER
Our Favourite Halloween Treat
Learners conduct a survey about Halloween candy and create a bar graph illustrating the data. In this data analysis lesson, stud nets are introduced to the topic with a discussion and survey, then the class creates a large graph and...
Curated OER
The Power of Graphical Display: How to Use Graphs to Justify a Position, Prove a Point, or Mislead the Viewer
Analyze different types of graphs with learners. They conduct a survey and determine the mean, median and mode. They then identify different techniques for collecting data.
Kenan Fellows
How Does an Unhealthy Diet Influence our Health and Well-Being?
You are what you eat, or so they say! After surveying family and friends on a week of eating habits, learners analyze the data for patterns. They compare different variables such as fats and cost, fats and calories, or fats and LDLs.
Curated OER
Rescue Mission Game
Students conduct probability experiments. For this rescue mission lesson, sudents play a game and collect statistical data. They organize and interpret the data and determine the probability of success. Students plot points on a...
Curated OER
Decimals Decide Olympic Champions
The class discovers how a decimal can make all the difference in the Olympics. As they learn about decimal place values, they compare and contrast data and demonstrate decimal values using manipulatives.
PBL Pathways
Cell Phones
Calling all subscribers! Model revenue based on individual cell phone subscribers. The project-based learning activity presents a challenge to scholars from a cell phone company. Individuals model data provided to them from the company...
Curated OER
Math Can Be Electrifying
Students explore how math can be used to calculate and analyze how electricity causes air pollution. Students design a campaign to educate family members on ways they can save electricity. They create a graph that compares two electric...
Curated OER
Gathering, Recording, and Presenting Data
Sixth graders use the local newspaper to find and discuss examples of uses of statistics and the ways in which the information is presented. They create and represent their own set of data showing how students get to school each day.
Howard County Schools
Planning for Prom
Make the most of your prom—with math! Pupils write and use a quadratic model to determine the optimal price of prom tickets. After determining the costs associated with the event, learners use a graph to analyze the break even point(s).
Curated OER
Measurement and Paper Airplanes
Sixth graders investigate physics by creating paper airplanes. In this flight experiment lesson, 6th graders utilize stationary tools to create elaborate paper airplanes which they fly on their school grounds. Students complete...
Curated OER
Data From Interviews
Students create and conduct a survey about favorite foods, gather and represent the data, interpret data and make predictions to present to the class. They create and use interview questions to gather data. Pupils are explained that...
Curated OER
ou are the Researcher!
Students conduct a census at school. They collect data, tally it, and create a frequency table. Students display their data in three different types of graphs. They write complete sentences describing the graph.
Curated OER
Student Heights
Students measure the heights of their fellow classmates and create a box and whisker plot to display the data. In this measurement lesson plan, students analyze the data and record results.
Curated OER
Tables, Charts and Graphs
Students examine a science journal to develop an understanding of graphs in science. In this data analysis lesson, students read an article from the Natural Inquirer and discuss the meaning of the included graph. Students create a...
Curated OER
How Much Is Too Much?
Students examine population growth and collect data. In this statistics instructional activity, students create a scatter plot to represent the different species found in the water and are being harvested. They graph their data and draw...
Intel
What Does This Graph Tell You?
What can math say about natural phenomena? The fifth STEM lesson in this project-based learning series asks collaborative groups to choose a phenomenon of interest and design an experiment to simulate the phenomenon. After collecting...
Beyond Benign
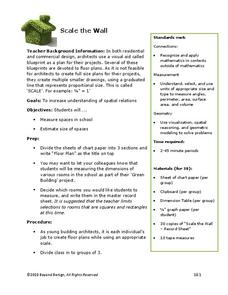
Scale the Wall
How can you fit an entire school on one sheet of paper? You use scale! Scholars measure rooms in the school and, using the correct scale, design a floor plan that includes area calculations with their data.
Curated OER
Remembering Our Veterans Data Management Project
Seventh graders utilize data collected from various sources based on Canadian military statistics to consolidate their understanding of data management. Students plan and create a PowerPoint presentation using this data including in...
Curated OER
Using Current Data for Graphing Skills
Students graph demographic information. In this graphing lesson, students choose what type of graph to create and what information to display. Links to examples of graphs and statistical data are provided. The graphs are created on the...
Curated OER
Current Weather
A great year around activity that shows young mathematicians how the math skills they are learning are actually used in the real world. This exercise also helps learners begin to distinguish the difference between weather and climate. As...
Curated OER
Data Analysis Digital Display
Students create a survey online. In this math lesson, students graph survey data using flisti.com. They share and analyze their classmates' histogram.
Other popular searches
- Math Data Interpretation
- Math Analyzing Data
- Data/math Literature
- Math and Data Management
- Math Lesson Data Management
- Math Data
- Mathematics Chance and Data
- Math Lessons Organizing Data
- Math Data Collecting
- Math Bivariate Data
- Math/data Mean Mode Median
- Math Data Analysis


