Curated OER
Tables, Charts and Graphs
Students examine a science journal to develop an understanding of graphs in science. In this data analysis lesson, students read an article from the Natural Inquirer and discuss the meaning of the included graph. Students create a...
Curated OER
Body Measuring Activity
Young scholars explore geometry by participating in a measurement activity. In this human anatomy lesson plan, students identify the appropriate methods to measure human body parts and do so in class. Young scholars create a bar graph...
Curated OER
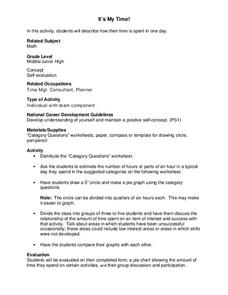
It's My Time!
Students create a pie chart. In this time lesson, students determine the amount of time they spend on given activities. They create a pie chart diagraming the data. Students share their graphs with the class.
Curated OER
The constitution and Our Republic
Students record and interpret data. In this constitution lesson, students discuss voting and making bar graphs. Students practice voting and do a bar graph activity. Students make visual representations of votes on the board.
Curated OER
Take Another Look
Seventh graders analyze different types of graphs and answer questions related to each. In this math lesson, 7th graders organize a given diagram to make it easier to interpret. They discuss why they made such changes.
Curated OER
M & M Madness
Students work with the mathematics unit of collection, organization, and presentation of data. In this math and technology lesson plan, students use Valentine M & M’s and The Graph Club to sort and graph the various colored M & M’s.
Curated OER
Pizza, Pizza
Students survey community members to determine their favorite pizza toppings and create a bar graph to show their findings. In this probability and statistics lesson, students collect data by conducting a survey. They analyze the data,...
Curated OER
Veggie Chop and Data Analysis
First graders chop vegetables into fractions. In this fractions lesson, 1st graders cut vegetables, collect data about favorite vegetables and create a bar graph using the information. Students make inferences about the data and record...
Curated OER
Consumer Confusion: Wants versus Needs and Gandhi's Wisdom
Fourth graders create graphs to illustrate consumer consumption throughout the world. In this consumer lesson plan, 4th graders also discuss wants and needs around the world, and consider Gandhi's opinion on material possessions as they...
Curated OER
Earth Energy Budget Pre Lab
Students explore energy by conducting an in class experiment. In this climate change lesson, students conduct a water vapor experiment in a soda bottle. Students utilize graphs and charts to analyze the results of the experiment and help...
Mathematics Vision Project
Module 2: Systems of Equations and Inequalities
The brother-sister pair Carlos and Clarita need your class's help in developing their new pet sitting business. Through a variety of scenarios and concerns presented to the siblings, the learners thoroughly explore systems of equations...
Fall River Schools
Parabolas Are All Around Us
Moving parabolas off of graph paper and into the real world is the task at hand in this detailed poster project. First, learners perform a cumulative activity identifying many characteristics of an assigned quadratic equation. Next, they...
Curated OER
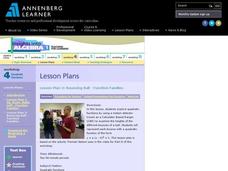
Bouncing Ball : Function Families
A bouncing ball serves as more than entertainment when learning to apply quadratic functions to real-world events. This is the second of a two-part lesson, which can also be accessed from the website. The instructions say to measure the...
Curated OER
Coloring Interval Graphs
Students investigate planning an activity and getting it done on time. In this algebra lesson, students define vocabulary words related quadratic equations, including the vertex and intervals. They figure a good way to color graphs...
Curated OER
Storybook Character Graph
First graders dress as their favorite storybook character. They draw a self-portrait, then place the drawing on a graph.
Curated OER
Geometry: Helix-a-Graph
High schoolers use geometry to create art. For this geometric graphing and patterns lesson, students create a helix-a-graph by plotting points on a grid that follow a certain pattern and analyze the drawing they created.
Curated OER
Activity Plan Mixed Ages: Family Math
Students play with math. In this early childhood lesson plan, students create drawings of family members to use for math activities including counting, seriating, sorting, grouping, and sequencing.
Curated OER
Just Look at Our Shoes
Students complete cross-curricular activities using a shoe theme. In this cross-curricular instructional activity, students explore various systems, examine open and closed systems, and examine product life cycles.
PBL Pathways
Potassium-Argon Dating
Find the age of a fictional sample of rocks using a genuine approach. A well-designed lesson asks young mathematicians to use exponential modeling to analyze half-life. As a project-based learning activity, scholars communicate their...
Curated OER
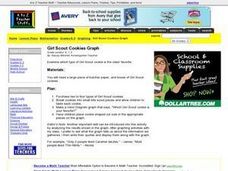
Girl Scout Cookies Graph
Students graph which girl scout cookies they like the best. They create a Venn Diagram about which one is their favorite. They place cookie shaped cutouts on the correct spot on the graph.
Curated OER
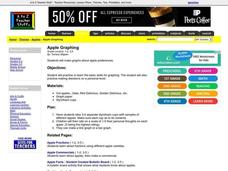
Apple Graphing
Students sample a variety of types of apples and then survey each other regarding their favorites. They chart how many students prefer each type of apple.
Curated OER
Pictograph to Bar Graph
Second graders explore organizing data to make it useful for interpreting picture graphs and bar graphs. They use Graphers software to create a pictograph and a bar graph.
Curated OER
"Graph It"
Students work in teams to conduct short surveys of their classmates. They show their results using at least two different types of graphs.
Students separate into teams and are asked that each team to choose something that they are...
Curated OER
Introduction to Bar Graphs Lesson Plan
Young scholars organize and interpret data using bar graphs.
Other popular searches
- Elementary Graphing Activity
- M&m Graphing Activity
- Holiday Graphing Activity
- Line Graphing Activity
- Biology Graphing Activity
- Science Graphing Activity
- Halloween Graphing Activity
- Ell Graphing Activity
- Graphing Activity Velocity
- States Graphing Activity
- Hurricane Graphing Activity
- Free M&m Graphing Activity


