Curated OER
Graphing With Paper and Computers
Fourth graders construct bar graphs. In this graphing lesson, 4th graders create bar graphs in connection with the story, The Copycat Fish. After creating the initial graphs on paper, students use MS Excel to create graphs.
Curated OER
PowerPoint Project for Creating a New Business
Students create a mock new business for which they design a PowerPoint presentation. They include company information, financial statements, graphs, advertising and management promotion pages in the final presentation.
Curated OER
Your Just Desserts
Students write letters to town officials and local businesses asking for favorite dessert recipes. They tabulate their responses in a spreadsheet. Students turn their survey results into colorful graphs.
Curated OER
Topic 6: Evaluating and Presenting Results
Young scholars construct spreadsheets from raw data. In this spreadsheet construction activity, students compile data into Microsoft Excel. Young scholars familiarize themselves with entering and presenting data in a spreadsheet.
Curated OER
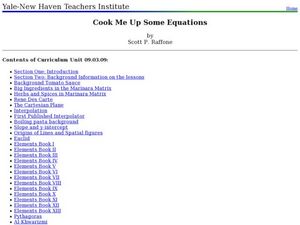
Cook Me Up Some Equations
Students study a variety of math concepts in the context of cooking up a meal. In this math lesson, students calculate surface area and volume. They draw and interpret different types of graphs.


