Curated OER
Ornithology and Real World Science
Double click that mouse because you just found an amazing lesson! This cross-curricular Ornithology lesson incorporates literature, writing, reading informational text, data collection, scientific inquiry, Internet research, art, and...
Curated OER
When Ants Fly
Here is a great lesson on constructing line graphs. Learners identify common characteristics of birds, ants common needs of all living things. They also write a story from the perspective of an ant or a bird that has lost its home and...
Alabama Learning Exchange
I Know What You Did Last Summer: A Data Graphing Project
Young scholars participate in graphing data. In this graphing data instructional activity, students make a stem and leaf plot of their summer activities. Young scholars create numerous graphs on poster boards. Students...
Curated OER
What's in the Water? - Stream Side Science
Here is a complete activity in which young biologists or ecologists test the pH, dissolved oxygen, turbidity and temperature of stream water. The class visits an actual stream and makes observations of the site. They use scientific...
Curated OER
Nutrition and Food Security
Examine the three basic nutrients and their effects on the body. Fifth graders will research data to construct a bar graph and then demonstrate the relationship between malnutrition and food security. This is a very comprehensive...
Curated OER
Environmental Agents of Mathematics: Mathematics for Change
High schoolers analyze environmental science data using Math. They do research about renewable energy, gather data, create graphs and interpret their findings. Then the group presents their arguments persuasively using their findings to...
Curated OER
Monitoring Estuarine Water Quality
Students analyze water quality data from real data. In this environmental science instructional activity, students examine how salinity and dissolved oxygen affect the living organisms in the estuary. They interpret graphs to support or...
Curated OER
Science in Focus: Force and Motion
Students explore force and motion through a series of experiments. In this physics instructional activity, students create and interpret speed graphs. They build an electromagnet and explain the factors affecting its strength.
Curated OER
Graphing Weather
Students make a graph. In this weather lesson, students fill in a KWL chart about different types of weather. Students watch a PowerPoint presentation about weather and natural disasters and where these types of weather are common....
Curated OER
Exploring Renewable Energy Through Graphs and Statistics
Ninth graders identify different sources of renewable and nonrenewable energy. In this math instructional activity, learners calculate their own carbon footprint based on the carbon dioxide they create daily. They use statistics to...
Curated OER
Settlement Exploration: Then and Now
NASA has crafted an imaginative and memorable series of lessons, "NASA and Jamestown Education Module." This lesson is one of the five components. In it, middle schoolers connect history and science by comparing the settlement of...
Curated OER
Mathematics in Bioengineering: Its Application for Today's Students
High schoolers explore the different fields of bioengineering. They will create and interpret graphs from cancel cells data. They then calculate the amount of drugs found in blood and eliminated by the body over time.
Curated OER
Earth Energy Budget Pre Lab
Learners explore energy by conducting an in class experiment. In this climate change instructional activity, students conduct a water vapor experiment in a soda bottle. Learners utilize graphs and charts to analyze the results of the...
eGFI
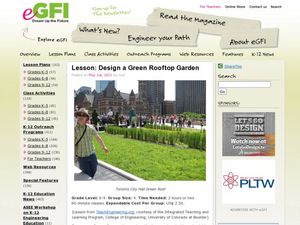
Design a Green Rooftop Garden
Design and construct buildings with rooftop gardens. Junior engineers work in groups to build two buildings and then perform experiments to determine whether or not a garden affects the building's temperatures. They graph and interpret...
Curated OER
Interpreting Medical Data
Students explore human anatomy by graphing scientific data. In this vision lesson, students discuss how ophthalmology works and take their own eye assessment test using the Snellen chart. Students collect vision data from all of their...
Curated OER
Volcano Spreadsheet and Graph
Fourth graders use data from volcanoes to organize a spreadsheet and make a graph.
Curated OER
Take Another Look
Seventh graders analyze different types of graphs and answer questions related to each. In this math lesson, 7th graders organize a given diagram to make it easier to interpret. They discuss why they made such changes.
Alabama Learning Exchange
How Old is Your Money?
Elementary learners explore coin mint dates. First, they listen to the book Alexander Who Used to be Rich Last Sunday by Judith Viorst. They then sort a collection of coins according to their mint date and put them in order from oldest...
Curated OER
Pecan Power
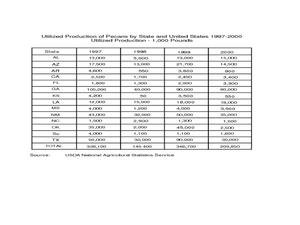
Students study the origins of pecans and complete a bar graph from the data they have discovered. In this pecan lesson plan, students draw pecans, discuss a pecan time line, and draw a bar graph comparing Arizona pecans to other...
Curated OER
Rock Art
Fourth graders examine and interpret rock art to illustrate its importance in the cultural heritage of a people and as a tool for learning about the past. They create their own rock art that is a symbol of their culture.
Curated OER
Plant Nutrition and Nutrients
Students observe seeds growth and examine the different parts of the seedling. In this biology lesson, students compare the growth of seeds planted in soil and in hydroponics. They record their observations in their science journal and...
Alabama Learning Exchange
Scaling Down the Solar System
Learners work collaboratively to gain a better understanding of the vastness of space by scaling down the solar system. They measure by inches, gain an understanding of space, and model the distances of the planets from the sun.
Curated OER
Motion: Speed, Velocity, Acceleration and Networking
Students interpret a variety of motion graphs. In this physics lesson, students calculate the speed and acceleration of objects using numerical data from graphs. They apply what they have learned to solve real world problems.
Curated OER
Under the Sea - Ocean Mammals/Fish
Students explore the similarities and differences between ocean mammals and fish. The characteristics of the life forms observed are placed onto a graph. The classroom becomes the botom of the sea and is explored to gain the required data.


