Alabama Learning Exchange
I Know What You Did Last Summer: A Data Graphing Project
Young scholars participate in graphing data. In this graphing data instructional activity, students make a stem and leaf plot of their summer activities. Young scholars create numerous graphs on poster boards. Students...
Mathematics Vision Project
Module 2: Systems of Equations and Inequalities
The brother-sister pair Carlos and Clarita need your class's help in developing their new pet sitting business. Through a variety of scenarios and concerns presented to the siblings, the learners thoroughly explore systems of equations...
Curated OER
Build A Skittles Graph
Students explore graphing. In this graphing activity, students sort Skittles candies and use the color groups to create a bar graph. Rubrics and extension activities are provided.
Curated OER
Walk-A-Thon
Students graph linear http://www.lessonplanet.com/review?id=180542equations. In this problem solving lesson, students calculate slope and plot ordered pairs on a coordinate grid. Using a real-life example of a walk-a-thon, students...
Curated OER
Build a Skittles Graph
Students construct a bar graph with a given set of data. They calculate the ratio and percent of the data. Students discuss alternate ways of graphing the data as well as multiple strategies to approach the task.
Curated OER
Exploring Renewable Energy Through Graphs and Statistics
Ninth graders identify different sources of renewable and nonrenewable energy. In this math instructional activity, learners calculate their own carbon footprint based on the carbon dioxide they create daily. They use statistics to...
Ms. Amber Nakamura's Mathematics Website
Algebra Project
What would your dream house look like? A cottage? A medieval castle? High schoolers enrolled in Algebra design the perfect house while using slopes to write equations for various aspects of the project.
Curated OER
Is there Treasure in Trash?
More people, more garbage! Young environmentalists graph population growth against the amount of garbage generated per year and find a linear model that best fits the data. This is an older resource that could benefit from more recent...
Curated OER
Which Car Should I Buy?
Students use gas mileage of different cars to create T charts, algebraic equations, and graphs to show which gets better mileage. In this gas mileage lesson plan, students use the graph to see which car they should buy.
Curated OER
Tune...Um!
Learners collect real data on sound. In this algebra lesson, students use a CBL and graphing calculator to observe the graph created by sound waves. They draw conclusion about the frequency of sound from the graph.
Curated OER
Cruising the Internet
Students identify the parts of an engine using a graph. In this statistics lesson, students make a graph from their collected data. They calculate the volume of a cylinder using a line of regression and a scatter plot.
Curated OER
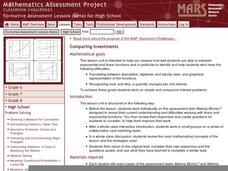
Comparing Investments
Money, money, money. A complete lesson that makes use of different representations of simple and compound interest, including written scenarios, tables, graphs, and equations to highlight similarities and differences between linear and...
Curated OER
Reaching New Heights
Students explore the relationship between two variables. Students measure their arm span and height. They gather this class data to design a scatter plot. Students interpret the meaning of individual coordinates and the overall graph....
Curated OER
Let's Plot Points
Use coordinate grid paper to plot points and identify shapes that are already plotted on the paper by saying their coordinates. Pupils also measure the distance between points and play the game Battleship. There are several web links and...
California Education Partners
Animals of Rhomaar
Investigate the growth rates of alien animals. Pupils study fictional animals from another planet to determine how much they grow per year. The investigators plot the growth of their animals over a period of time and then compare...
Curated OER
Under the Sea - Ocean Mammals/Fish
Students explore the similarities and differences between ocean mammals and fish. The characteristics of the life forms observed are placed onto a graph. The classroom becomes the botom of the sea and is explored to gain the required data.
Curated OER
Cook Me Up Some Equations
Young scholars study a variety of math concepts in the context of cooking up a meal. In this math lesson, students calculate surface area and volume. They draw and interpret different types of graphs.
Curated OER
Slip Slide'n Away
Young scholars analyze the sliding of boxes along a warehouse floor. In this algebra lesson, students connect math and physics by calculating the friction created by the sliding of each box. They develop faster method to move the box,...
Curated OER
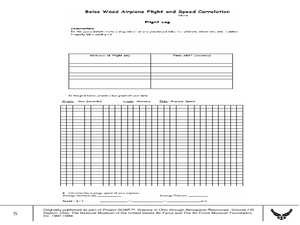
Balsa Wood Airplane Flight and Speed Correlation
Ninth graders calculate the average speed of their balsa wood airplane. In this physics lesson, 9th graders build their own airplane and make necessary modifications to to make it fly straight. They interpret distance and time graph...
Curated OER
Dental Impressions
What an impressive task it is to make dental impressions! Pupils learn how dentists use proportional reasoning, unit conversions, and systems of equations to estimate the materials needed to make stone models of dental impressions....
Curated OER
Dimensional Space: Various Perspectives
Students use their understanding of 3D on 2D to make a representation of a 4D form on paper.
Curated OER
Quilting Geometry
Study geometry through the concept of quilt design. High schoolers examine the geometric shapes in various quilts and then create their own quilts using geometric shapes that fit together. In the end, they write a paragraph to...
Curated OER
Let's Go Shopping: Estimation At The Mall
Students estimate the total cost of a shopping trip. In this estimation lesson, students use three different techniques to estimate how much a shopping trip will cost.
Curated OER
Pay Check Advance Loan
Students research loans. In this financial lesson plan, students explore the benefits and drawbacks of applying for a pay-day advance loan. Students compare different programs and calculate interest owed. Multiple resources are provided.


