Alabama Learning Exchange
I Know What You Did Last Summer: A Data Graphing Project
Young scholars participate in graphing data. In this graphing data lesson, students make a stem and leaf plot of their summer activities. Young scholars create numerous graphs on poster boards. Students discuss the...
Curated OER
Ornithology and Real World Science
Double click that mouse because you just found an amazing lesson plan! This cross-curricular Ornithology lesson plan incorporates literature, writing, reading informational text, data collection, scientific inquiry, Internet research,...
Curated OER
Level III: Technology Integration
Fourth graders prepare two spreadsheets each with an embedded line graph that displays data about the growth of the bitter rot fungus on apples and on petri dishes that were stored in the refrigerator and the classroom. They prepare a...
Curated OER
Interpreting Medical Data
Students explore human anatomy by graphing scientific data. In this vision lesson, students discuss how ophthalmology works and take their own eye assessment test using the Snellen chart. Students collect vision data from all of their...
Curated OER
Nutrition and Food Security
Examine the three basic nutrients and their effects on the body. Fifth graders will research data to construct a bar graph and then demonstrate the relationship between malnutrition and food security. This is a very comprehensive...
Curated OER
When Ants Fly
Here is a great instructional activity on constructing line graphs. Learners identify common characteristics of birds, ants common needs of all living things. They also write a story from the perspective of an ant or a bird that has lost...
Curated OER
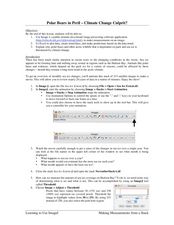
Polar Bears in Peril - Climate Change Culprit?
High schoolers explore the changes in sea ice over several years. In this life science instructional activity, students review and examine 20 years of data. They use Excel to graph data and analyze trends.
Purdue University
The Represented World: Recreational STEM
How are forces and motion important to a swing set? Scholars explore the concepts of force and motion using swing sets. In preparation for their own STEM design project, individuals take surveys and data from peers, complete labs on...
Curated OER
Creek Detectives WISE On-line Research Community
Students investigate ways people cause harm to the environment. In this environmental instructional activity, students explore a case study on the Internet. Students explore all of the online activities and collect data for a presentation.
Curated OER
The Greenhouse Effect
Seventh graders investigate the temperature change in open and closed containers. In this earth science lesson, 7th graders relate this lab activity to greenhouse effect. They create a line graph from data collected in the experiment.
Alabama Learning Exchange
How Old is Your Money?
Elementary learners explore coin mint dates. First, they listen to the book Alexander Who Used to be Rich Last Sunday by Judith Viorst. They then sort a collection of coins according to their mint date and put them in order from oldest...
Curated OER
MAISA and the REMC Association of Michigan
Students complete online research to study geography's impact on weather. In this geography and weather lesson, students research weather in their city for ten days using an online website. Students bookmark the site, enter data into a...
Curated OER
Halloween Graphitti
Students complete multi-curricular activities in a Halloween themed lesson. In this Halloween lesson, students examine newspaper ads to find prices of pumpkins and use them to complete a stem and leaf plot. Students find the diameter,...
Beyond Benign
Water Bottle Unit
How much plastic do manufacturers use to create water bottles each year? The class explores the number of water bottles used throughout the years to determine how many consumers will use in the future. Class members compare different...
Curated OER
How Do Plants Grow?
Students investigate plant growth. In this plant growth lesson, students investigate what would happen to plants if they did not have water and sunlight. Students conduct experiments to determine what plants need. Students create a...
Curated OER
Take Another Look
Seventh graders analyze different types of graphs and answer questions related to each. In this math lesson, 7th graders organize a given diagram to make it easier to interpret. They discuss why they made such changes.
Curated OER
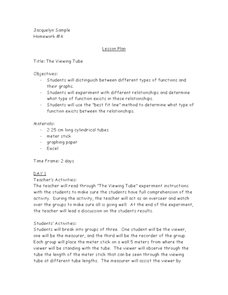
The Viewing Tube
Looking for an excellent lesson that incorporates math, science, and technology? Groups of three students use a viewing tube to perform an experiment, and discover how to organize their data into an Excel spreadsheet. This is a...
Curated OER
What's the Fizz Factor
Students as a class create a fountain using both coke soda, and mentos candy. In this science lesson, students test which combination of coke and mentos products produce the tallest fountain. Students use the scientific method to track...
Curated OER
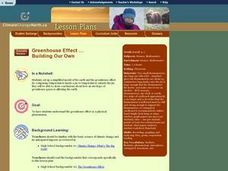
Greenhouse Effect ...Building Our Own
Young scholars explore the greenhouse effect. They set up a simplified model of the earth and the greenhouse effect. Students compare temperatures inside a jar to temperatures outside the jar. Pupils collect information and create a line...
Curated OER
Exploring The Depths!
Fifth graders make a model of the ocean floor. In this ocean characteristics lesson plan, 5th graders complete a KWL chart about the ocean floor, use the Ocean Depth Data Sheet to create a graph, and create a 3-D model of the ocean...
Curated OER
A Fishy Tale
Eighth graders do a research project on a particular species of Atlantic seafood and record and graph information pertaining to commercial landings of that species of seafood. They use a website and an Appleworks spreadsheet.
Curated OER
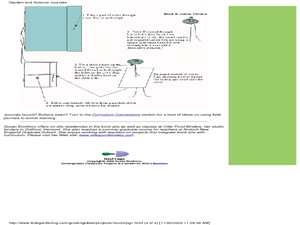
Making Field Journals
Students follow a bookmaking format to create a book and use it as a garden journal. For this science journal lesson, students follow book making directions to create a garden and science journal.
Curated OER
Keep It Cool
Students complete a science experiment to study insulation, heat transfer, and permafrost. In this permafrost study lesson, students design and test a soda insulator. Students graph their class data and discuss the results. Students...
Curated OER
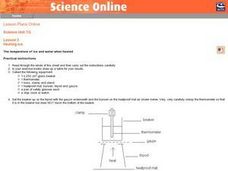
Heating Ice: The temperature of ice and water when heated
Seventh graders read and follow the instructions on the worksheet. They make a table of their results. Students use about 100 cm^3 of water and ice mixture. They heat the water/ice with a Bunsen burner. Temperature is recorded every 30...


