Curated OER
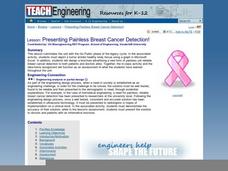
Presenting Painless Breast Cancer Detection!
Students depict a tumor inside a healthy body using a graph in Microsoft Excel. in this breast cancer lesson plan, students also design a brochure that advertises a new form of painless breast cancer treatment.
Curated OER
Creating Circle Graphs with Microsoft Excel
Seventh graders will learn how to construct circle graphs using paper and pencil. Then they will learn how to construct circle graphs using Microsoft Excel. This lesson uses technology and shows learners how to cross skills into the...
Curated OER
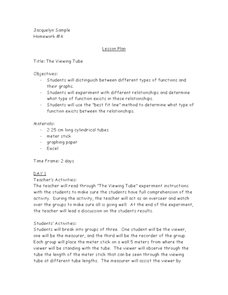
The Viewing Tube
Looking for an excellent lesson that incorporates math, science, and technology? Groups of three students use a viewing tube to perform an experiment, and discover how to organize their data into an Excel spreadsheet. This is a very...
Curated OER
Skittle it Up
Students make a graph. In this graphing and Excel lesson, students work in groups and are given a bag of skittles. Students count the number of each color skittle and create a table in Excel. Students learn how to make a pie graph using...
Curated OER
Chart Challenge: Behavior Management
Students develop a behavior management plan using Excel. They use the computer to develop a behavior chart. Students record their behavior on a daily basis using the chart they developed using Excel.
Curated OER
Microsoft Office Excel
Students use Microsoft Office Excel. For this technology lesson, students enter data on a spreadsheet using Excel. This programs tallies data and presents it using graphs.
Curated OER
Fairy Tales
Sixth graders explore the elements of fairy tales. For this fairy tales lesson, 6th graders analyze several versions of Cinderella from around the world. Students graph fairy tale elements using Excel and create Venn diagrams comparing...
Curated OER
Using Spreadsheets and Graphs
Third graders explore mathematics by utilizing computers. In this graphing lesson, 3rd graders gather class data based on a particular topic such as the "favorite candy" of the class. Students utilize this information and computers to...
Curated OER
Computer Science: Pendulum
Students investigate the basic properties of pendulums as a function of spreadsheets. Working in groups, they measure the period for a pendulum at six different lengths and record the results. They prepare a file using Microsoft Excel...
Curated OER
"Living in the Limelight The Universal Dream"
Students, using Leo's Lyrics, investigate common themes in popular music. They create a Microsoft Excel spreadsheet that analyzes their findings along with a 200 word paragraph stating their observations, conclusions and hypotheses about...
Curated OER
Topic 6: Evaluating and Presenting Results
Students construct spreadsheets from raw data. In this spreadsheet construction lesson, students compile data into Microsoft Excel. Students familiarize themselves with entering and presenting data in a spreadsheet.
Curated OER
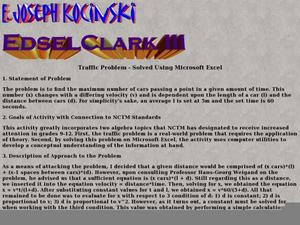
Traffic Problem- Solved Using Microsoft Excel
Young scholars relate algebra to real life scenario. In this algebra instructional activity, students design a plan to help traffic flow smoothly using velocity and speed. This assignment is done using Microsoft Excel.
Education World
A Spooky Adlib Story
Learners navigate a simple spreadsheet and develop their creativity. They answer questions, filling in cells on Excel, using a template after filling in all the fields, a silly spooky story is created from the answers they give. Students...
Curated OER
Graphing Our Marbles
Students collect information pertaining to marble colors found in their bag; then creating a spreadsheet in order to make a chart representing their findings using Microsoft Excel. Students will present their results to small groups.
Curated OER
Integrated Project
Young scholars participate in a project that integrates Microsoft Word, Excel and PowerPoint. In groups, they write a proposal for their project and complete the necessary steps to create and design it. To end the lesson, they are...
Curated OER
Creating Your Own Web Site
Students explore and explain how to design Web pages complete with text, graphics, and hypertext links. After adding backgrounds, navigation buttons, and audio-visual effects, and revising their work based on comments from peers and...
Curated OER
History Trifold in Publisher
Students create a timeline of events happening around the world. In this timeline lesson plan, students use Microsoft Publisher to create a timeline of events happening around the world as they live their lives presently.
Curated OER
Animal Characteristics
Learners create a graphic organizer to study animal characteristics. In this animal characteristics lesson plan, students use a program in Microsoft Word to create a brainstorm about different animal characteristics.
Curated OER
Data! Data! Graph that Data!
Fifth graders create data graphs using Microsoft Excel. For this data collection lesson, 5th graders create and conduct a survey, then use Excel to organize and graph their data.
Curated OER
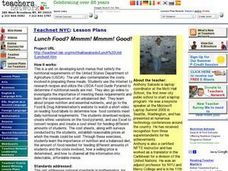
Lunch Food? Mmmm! Mmmm! Good!
Examine how nutrition plays an important role in our lives by conducting online research and developing lunch menus that satisfy nutritional requirements set up by the United States Department of Agriculture. Students download recipes,...
Alabama Learning Exchange
The State Capital of Stem and Leaf
Students explore the concept of stem and leaf plots. For this stem and leaf plots lesson, students plot the 50 US states' capitals on a stem and leaf plot according to the first letter of each state. Students compare their stem and...
Curated OER
Skyscraper Capers
Young scholars discuss skyscrapers and listen as the teacher introduces the project. They use the Internet to perform research on one skyscraper. Students use information they gather to create a brochure of their building . They create...
Curated OER
Planet PowerPoint Lesson
Looking for a good, technology-based science lesson for your 3rd graders? This lesson is worth a look! They will utilize PowerPoint to create a presentation for the class on a planet of their choice. They also use document cameras, a...
Curated OER
Deep Blue Sea
Elementary schoolers identify the ocean floor in a geological sense. They create a presentation that highlights the key features of the ocean floor. This terrific lesson plan has excellent streaming video segments embedded in it, and the...
Other popular searches
- Microsoft Excel Spreadsheets
- Microsoft Excel Lessons
- Microsoft Excel 2003
- Microsoft Excel Projects
- Beginning Microsoft Excel
- Microsoft Excel Lesson Plans
- Microsoft Excel Formulas
- Microsoft Excel Navigation
- Microsoft Excel Basics
- Microsoft Excel 2007
- Microsoft Office Excel 2007
- Microsoft Excel 2003 Lessons


