Curated OER
Weather Instrument Use and Application
Eighth graders measure temperature, wind speed and pressure using Skymaster SM-28. In this earth science lesson, 8th graders collect data and record observations taken from outdoors. They explain why numerical values are different in...
Curated OER
Newton’s Laws of Motion
Eighth graders explore the three laws of motion. In this physics lesson plan, 8th graders observe teacher demonstration and explain what happened in terms of Newton's Laws. They complete worksheet at the end of the lesson plan.
Curated OER
Testing Foods
Young scholars perform an experiment using brown paper bags to determine which foods have oil in them. This task assesses student's abilities to make simple observations and inferences from them.
Curated OER
Mystery Card 2
Students make a circuit on a mystery card. They then use an electrical tester to determine where electricity flows between circles on the card. They will connect wires, bulbs, and a battery to form an electrical tester.
Curated OER
Mystery Boxes
Students make observations about Mystery Boxes that their teacher has made up and describes the motion of the object inside the box and hypothesizes it's shape based on their observations.
Curated OER
Color Dots 3
Students make simple observations, test mixtures, and make generalized inferences from their observations. They observe bleeding of colored inks with water.
Curated OER
Animals Piece by Piece
Students sort organisms and objects into groups according to their parts and describe how the groups are formed.They identify body parts of animals from puzzle pieces, assemble the puzzle, and name the animal.
Curated OER
Electrical Circuits And Switches
Students design and draw circuits with batteries, small light bulbs and common household conductors. They build and test the circuit then modify it so someone who couldn't use their hands could turn the circuit on and off.
Curated OER
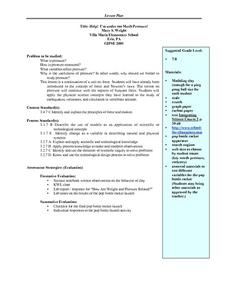
Help! I'm Under Too Much Pressure!
Students play with a ping pong ball sized piece of modeling clay observing what happens to the clay as they play with it and write their observations in their notebooks. They share the results of their observations introducing the term...
Curated OER
Design of Airfoils and Problem- Solving Using FoilSim
Ninth graders, after reading the explanation given below, complete the problem-solving activities to demonstrate an understanding of the concepts presented.
Curated OER
Temperature and Altitude
Students, after reading the explanation given below, use FoilSim to gather and record data on temperature and altitude generated by the FoilSim control panel.
Curated OER
Tree Anatomy
Students learn the basic anatomy of a tree through exploration of tree centers.
Curated OER
Cleansing, Sparkling Koos
Students explore the importance of water conservation and investigate how plants clean water.
Curated OER
Valley of the Butterflies
First graders explore why butterfly populations in Idaho's Lapwai Valley have decreased.
Curated OER
Water Density Boundaries
Young scholars create observable layers in water that represent a separation based upon density differences. They model density boundaries using differences in temperature and salinity. They, in groups, perform a meaningful experiment...
Curated OER
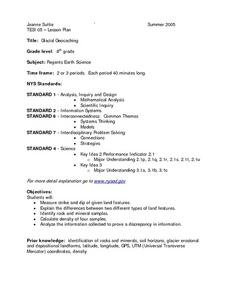
Glacial Geocaching
Eighth graders measure strike and dip of given land features and explain the difference between them. They also look at rock and mineral samples for indentification, along with calculating the density. Finally, information is analyzed...
Curated OER
Tracking the Weather Using Technology
Fourth graders explore the use of technology to monitor and forecast weather. They investigate the different types of weather monitoring and forecast tools. Students interpret radar images and discuss the traditional types of weather...
Curated OER
Biological Sampling Device Using a Sea Perch
Students construct plankton nets to be towed and collect specimens to be examined and analyzed in the classroom. They develop research skills through collection of an aquatic sample. They write lab reports after interpreting, identifying...
Curated OER
Sea Ice Research
Students study sea ice and its importance in climate and climate change. They discuss sea ice as a presence of a food source for marine animals in the arctic and complete a lab activity. After completing the lab, they watch a video...
Curated OER
Traditional Uses of Wood
First graders explore properties of wood used to make cultural items and make a ring and stick game.
Curated OER
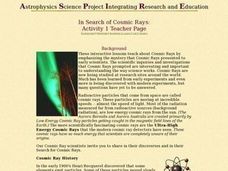
In Search of Cosmic Rays
Learners compare rates to altitude. They conduct a class discussion about the results.
Curated OER
Earth/Globe (poles & equator)
First graders create his/her own paper mache earth and label the poles and equator. The land masses can be added and labeling of specific bodies of water. The paper mache earth can then be used to discuss the sun, moon, and the earth and...
Curated OER
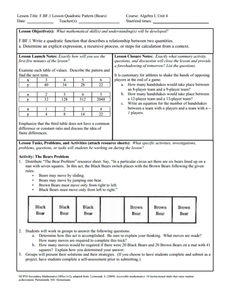
Bears
Pupils complete a variety of bear-related activities. They sort and graph teddy bears, distinguish between real and non-real bears and research bear life cycles and habitats.
Curated OER
Calculating & Graphing Using a Spreadsheet
Students use the lab apparatus to calculate the average velocity and average acceleration at several points and record the data. They use the spreadsheets to plot distance vs. time, velocity vs. time and acceleration vs. time graphs.
Other popular searches
- Scientific Inquiry Lesson
- Scientific Inquiry Skills
- Scientific Inquiry Method
- Scientific Inquiry Health
- Scientific Inquiry Model
- Scientific Inquiry Process
- Scientific Inquiry Lab
- Scientific Inquiry Music
- Scientific Inquiry Questions
- Scientific Inquiry + Health
- Scientific Inquiry Experiments
- Scientific Inquiry and Design


