Curated OER
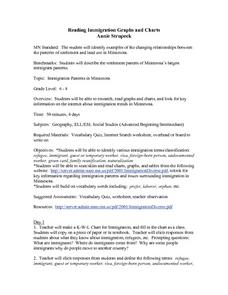
Reading Immigration Graphs and Charts
Students examine the settlement patterns and land use in Minnesota. In groups, they practice reading immigration graphs and charts and discuss why immigrants settled where they did. They are also introduced to new vocabulary related to...
Curated OER
Creating Line Graphs
Students relate data to coordinate graphs and plot points on this graph. They use minimum wage data to construct the graph. Students decide appropriate time intervals for the graphs. They share graphs with their classmates.
Curated OER
Line Graphs and Commercial Costs
Middle schoolers investigate line graphs. In this middle school mathematics lesson, students compare and contrast different types of graphs and create line graphs based on the data provided.
Curated OER
Temperature Bar Graph
Students explore mean, median and mode. In this math lesson, students analyze temperature data and figure the mean, median, and mode of the data. Students graph the data in a bar graph.
Curated OER
Creating Circle Graphs with Microsoft Excel
Students create graphs of circles. In this geometry lesson, students use Microsoft Excel to create graphs. They construct the graphs using paper and pencil as well as the computer.
Curated OER
Statistics of Mars
Students explore the concept of central tendencies. In this central tendencies lesson, students sort M&M's or Skittles based on color. Students graph their results. Students find the mean, median, and mode of their data.
Curated OER
Aerosol Lesson: Science - Graphing SAGE II Data
Learners examine and plot atmospheric data on bar graphs.
Curated OER
Have You Looked Outside? Lesson #5- Graphing Weather Conditions
First graders study daily weather changes. In this weather and graphing instructional activity, 1st graders chart the daily weather for a month using stickers or weather symbols. They graph the weekly weather so that at the end of the...
Curated OER
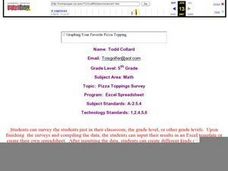
Graphing Your Favorite Pizza Topping
Fifth graders can survey the students just in their classroom, the grade level, or other grade levels. Upon finishing the surveys and compiling the data, the students can input their results in an Excel template or create their own...
Curated OER
Applied Science - Science and Math Lab
Students make a prediction. In this applied science lesson, students guess the number of items in a jar. Students create a bar graph to show the predictions and the actual amounts.
Curated OER
Discovering Mitosis in Onion Roots
High schoolers discover the different stages of mitosis by examining onion roots under a microscope, drawing diagrams of what they see, and organizing collected data in a chart and create a pie graph from their lab data.
NASA
Hurricanes as Heat Engines
Hurricanes are a destructive yet fascinating phenomenon. Individuals examine evidence that hurricanes use thermal energy from the ocean as they approach land. Learners use images, charts, and graphs to collect data and then draw...
Curated OER
Statistics with M&Ms
Seventh graders explore estimation, measurement, and probability. Students conduct surveys and create charts & graphs. They study the history of chocolate. Students design their own magazine advertisement or create a script for a...
Curated OER
Reading Graphs
Learners read graphs and charts to interpret results. In this algebra activity, students interpret bar, line and pictographs. They draw conclusions and make predicitons based on these charts.
Curated OER
Analyzing Graphs and Data
Students collect and analyze data. In this statistics lesson, students graph their data and make inferences from the collected data. They display their data using graphs, bar graphs, circles graphs and Venn diagrams.
Curated OER
Graphing
Students collect data and graph their results, then analyze the graphs. In this geometry lesson, students examine slopes and their graphs and discuss the relationship between the lines and the slopes.
Curated OER
The Numbers Tell the Story
Students demonstrate how to gather and interpret statistical data. In this data analysis lesson plan, students search for statistics on the health effects of smoking and place the information into charts. Students create these charts...
Curated OER
Probability Using M&M's
Students estimate and then count the number of each color of M&M's in their bag. In this mathematics lesson, students find the experimental probability of selecting each color from the bag. Students create pictographs and bar graphs...
Curated OER
Earth Energy Budget Pre Lab
Learners explore energy by conducting an in class experiment. In this climate change lesson, students conduct a water vapor experiment in a soda bottle. Learners utilize graphs and charts to analyze the results of the experiment and help...
Curated OER
Eat Your Veggies
Students investigate displaying data. In this displaying data lesson, students use tallies to count data about food preferences. Students use various types of graphs such as bar graphs, picture graphs, box-and-whisker plots, etc to...
Curated OER
Counting Candies
Students count, sort, and classify jellybeans by color. They use their data to create a bar graph. Students are given a small bag of jellybeans, and a worksheet on Counting Candies Tally Chart. They work in small groups. Students are...
Curated OER
Using Data Analysis to Review Linear Functions
Using either data provided or data that has been collected, young mathematicians graph linear functions to best fit their scatterplot. They also analyze their data and make predicitons based on the data. This instructional activity is...
Curated OER
Using Spreadsheets and Graphs
Third graders explore mathematics by utilizing computers. In this graphing lesson, 3rd graders gather class data based on a particular topic such as the "favorite candy" of the class. Students utilize this information and computers to...
Curated OER
Bar Graphs and Pie Charts
Students graph data they collected and analyze it using a bar graph. In this algebra lesson, students analyze their data using pie charts and bar graphs while explaining the meaning to each other. They compare and contrast bar graphs vs...
Other popular searches
- Pie Charts and Graphs
- Reading Charts and Graphs
- Behavior Charts and Graphs
- Charts and Graphs Candy
- Interpret Charts and Graphs
- Charts and Graphs Christmas
- Charts and Graphs Math
- Analyzing Charts and Graphs
- Tables, Charts and Graphs
- Charts and Graphs Europe
- Using Charts and Graphs
- Bar Graphs and Charts


