CK-12 Foundation
Multiple Line Graphs: Jack's Jumpshot
What are the advantages to seeing multiple data sets on the same graph? Scholars explore this question as they manipulate the animation within the lesson. Questions within the interactive ask individuals to make comparisons across the...
Balanced Assessment
Cost of Living
Math scholars investigate the cost of living in Hong Kong compared to Chicago but must first convert the different types of currency. They then choose a type of graph to compare different spending categories and finish the activity by...
Curated OER
Usage and Interpretation of Graphs
Students explore graphing. In this graphing activity, students predict how many shoe eyelets are present in the classroom. Students count eyelets and work in groups to organize and chart the data collected. Students put all the data...
Utah Education Network (UEN)
Linear Graphs Using Proportions and Rates
Using a TI-73 or other similar graphing calculator middle school math majors investigate the linear relationship of equivalent proportions. After a brief introduction by the teacher, class members participate in a timed pair share...
Curated OER
Ornithology and Real World Science
Double click that mouse because you just found an amazing instructional activity! This cross-curricular Ornithology instructional activity incorporates literature, writing, reading informational text, data collection, scientific inquiry,...
Curated OER
Reading Graphs
Learners read graphs and charts to interpret results. In this algebra lesson, students interpret bar, line and pictographs. They draw conclusions and make predicitons based on these charts.
Curated OER
Dealing with Data
Seventh graders collect and analyze data. In the seventh grade data analysis instructional activity, 7th graders explore and/or create frequency tables, multiple bar graphs, circle graphs, pictographs, histograms, line plots, stem...
National Nanotechnology Infrastructure Network
Lines on Paper - Laser Box
See what you cannot see by getting a little creative. An intriguing lesson has learners use lasers to explore X-ray diffraction. Given a box with unknown structures, they shine a laser through the box and interpret the results....
Curated OER
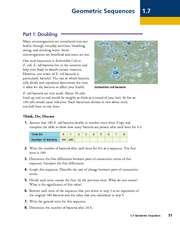
Geometric Sequences - Bacterial Growth
Bring algebra to life with scientific applications. Math minded individuals calculate and graph the time it takes a bacterium to double. They discuss geometric sequences and use a chart to graph their findings. There are 38...
Curated OER
Raisin the Statistical Roof
Use a box of raisins to help introduce the concept of data analysis. Learners collect, analyze and display their data using a variety of methods. The included worksheet takes them through a step-by-step analysis process and graphing.
Curated OER
Endangered Species
Ninth graders graph data in order to compare the number of extinct species and a rise in human population. They analyze the data collected. Students are encouraged to infer the relationship.
Alabama Learning Exchange
Scaling Down the Solar System
Learners work collaboratively to gain a better understanding of the vastness of space by scaling down the solar system. They measure by inches, gain an understanding of space, and model the distances of the planets from the sun.
Curated OER
Measuring Rainfall and Relationships Between pH, Alkalinity and Suspended Solids in the Pago River
Eleventh graders test the pH and alkalinity of Pago River. In this ecology lesson, 11th graders collect data and use spreadsheet to graph results. They analyze and share their findings with the class.
Curated OER
Can you Find the Expression
Pupils collect data from measurements and weights for this experiment. In this algebra lesson, students analyze graphs they create form their data to find the expression representing the data. They label which graph provided the best...


