Curated OER
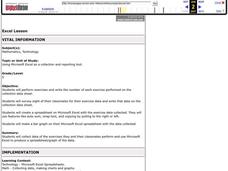
Excel Lesson
Fifth graders will perform exercises and write the number of each exercise performed on the collection data sheet. They survey eight of their classmates for their exercise data and write that data on the collection data sheet. They then...
Curated OER
Excel Lesson
Young scholars investigate Microsoft excel. In this technology lesson, students create formulas using excel and apply these formulas to solve relative, absolute and mixed reference cells. They perform immediate and delayed calculations.
Curated OER
Basic Algebra and Computers: Spreadsheets, Charts, and Simple Line Graphs
Students, while in the computer lab, assess how to use Microsoft Excel as a "graphing calculator." They view visual representations of line graphs in a Cartesian plane while incorporating basic skills for using Excel productively.
Curated OER
Using Spreadsheets and Graphs
Third graders explore mathematics by utilizing computers. In this graphing lesson, 3rd graders gather class data based on a particular topic such as the "favorite candy" of the class. Students utilize this information and computers to...
Curated OER
Conversation Heart Graphing
Sixth graders review the different types of graphs (bar, line, pictograph) They predict the data set they can garner several boxes of conversation hearts. Students record their data using an Excel spreadsheet. They create a graph based...
Curated OER
Using Excel to Reference and Graph Live Data from a Web Site
Students collect live buoy data about water temperatures in the Gulf of Mexico from the Internet and work individually to organize their data and create a line graph using Excel Spreadsheet. Students analyze their data and examine any...
Curated OER
A Comparison Study of Water Vapor Data to Precipitation over North America
Students use NASA satellite data to compare water vapor over the United States. For this data analysis lesson students use an Excel spreadsheet to map their data.
Curated OER
The Solstices
Compare surface temperatures when the solstice occurs in the different hemispheres. Young scientists draw conclusions from their investigation of data collected using spreadsheets and a globe.
Curated OER
Fast Food Survey Using Bar Graphs
Second graders create a bar graph to pictorically represent the data collected from a survey of students. They use Excel to electronically create the graphs and data tallies. They then interpret their data using sentences to explain.
Curated OER
The Hundred Penny Box
Sixth graders research payload specialists and see how many are men and how many are women and what countries they come from. They then create an excel spreadsheet to reflect data they found and must have two graphs for interpretation.
Curated OER
One, Two, Three...and They're Off
Students make origami frogs to race. After the race they measure the distance raced, collect the data, enter it into a chart. They then find the mean, median, and mode of the data. Next, students enter this data into Excel at which time...
Curated OER
Spreadsheet Function Machine
Students create a spreadsheet to analyze functions. In this algebra lesson, students use spreadsheets to find the intersection of systems of equations. They identify the dependent and independent function as it relates to a line.
Curated OER
Plants Under Attack
Third graders will identify the four needs for plant survival and gain skills and confidence in using scientific measurement tools, probes as well as the spreadsheets and graphing capacity of a computer to represent and analyze data.They...
Curated OER
What's Playing Tonight?
Young scholars collect data and visually represent it. They conduct a survey of favorite movies. Using a spreadsheet, students organize the data and create bar and circle graphs. Young scholars answer statistical questions regarding the...
Curated OER
Nascar Unit Activity 2
Eighth graders divide into groups of 4 or 5. They go to the track and have every student run/walk one lap around the school track. Call out their times as they cross the finish line. In the computer lab, have the students create a table...
Curated OER
Creating Climographs
Young scholars use satellite data to compare precipitation and surface temperatures on different islands. In this satellite instructional activity students create graphs and explain the differences between weather and climate.
Curated OER
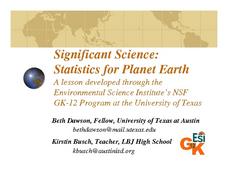
Significant Science: Statistics for Planet Earth
Ninth graders discover how statistics are used to interpret results of scientific experiments. Students write hypotheses and test the hypotheses by collecting data and organizing the data. Students graph their data to produce a visual....
Curated OER
Using A Volunteer Acquired Database Constructed On The Internet, Examine the Relationship between Dissolved Oxygen and Water Temperature
Ninth graders access a database and open a spreadsheet. In this oxygen and water temperature lesson students save the database, sort it and generate scatter plot graphs.
Curated OER
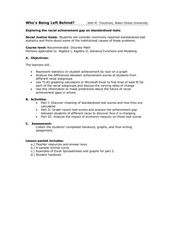
Who is Being Left Behind?
Students investigate scores as they relate to race. In this algebra lesson, students analyze standardized scores and how race can affect these scores. They plot their findings on a graph and draw conclusions.
Curated OER
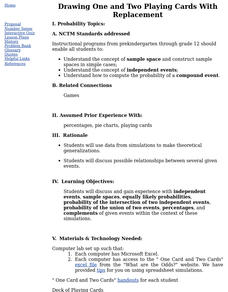
Drawing One and Two Playing Cards With Replacement
Math whizzes use data from simulations to make theoretical generalizations and discuss possible relationships between several given events. They use a simple card game to generate data to be analyzed.
Curated OER
All About Me: Measuring Height and Weight
Students take personal fitness inventories. In this personal health instructional activity, students take measurements of their heights and weights. Students record the data, calculate their BMI, and then chart their physical activity.
Curated OER
Earth Energy Budget Pre Lab
Learners explore energy by conducting an in class experiment. In this climate change lesson, students conduct a water vapor experiment in a soda bottle. Learners utilize graphs and charts to analyze the results of the experiment and help...
Curated OER
GeoHunt
Students describe the difference between geological resources and othe natural resources. They list the rocks, minerals, and fossil fuels that are found in Illinois and their uses. They identify ways to conserve natural resources.
Curated OER
Iterating the Function over Real Numbers
Students use a spreadsheet to find sequences of numbers. In this algebra lesson, students find the values for c of a quadratic written in standard form. They relate the behavior of the graph to the values of the equation.
Other popular searches
- Microsoft Excel Spreadsheets
- Using Excel Spreadsheets
- Excel Spreadsheets Graph
- Excel Spreadsheets Planets
- Creating Excel Spreadsheets
- Excel Spreadsheets Football
- Excel Spreadsheets Grades
- Nfl Excel Spreadsheets
- Excel Spreadsheets Soccer
- Basic Excel Spreadsheets
- Excel Spreadsheets Di Da


